Joseph E Stiglitz in Scientific American
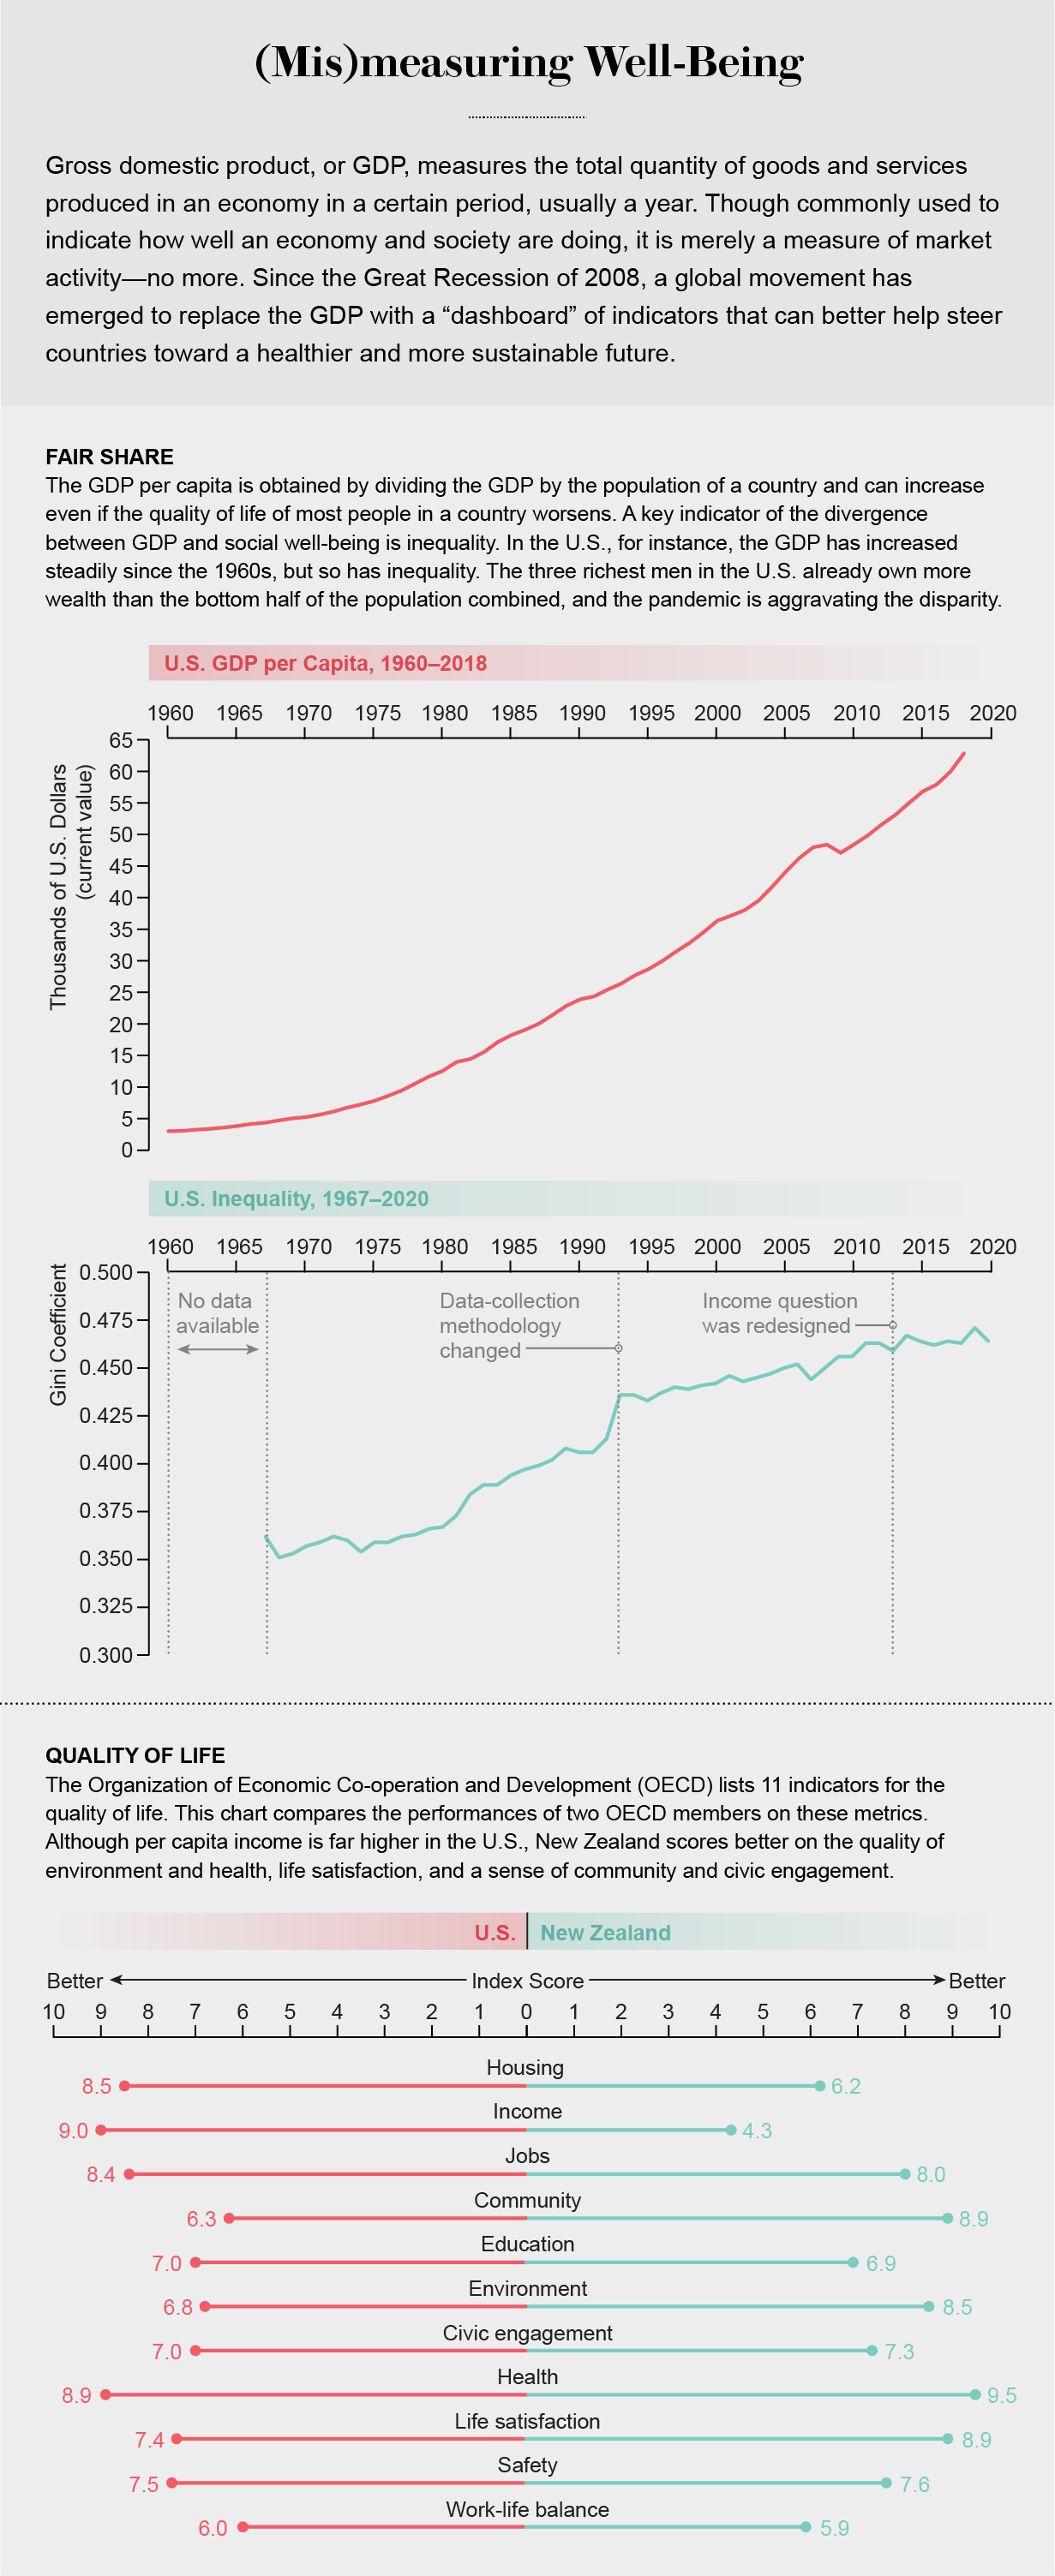
Since World War II, most countries around the world have come to use gross domestic product, or GDP, as the core metric for prosperity. The GDP measures market output: the monetary value of all the goods and services produced in an economy during a given period, usually a year. Governments can fail if this number falls—and so, not surprisingly, governments strive to make it climb. But striving to grow GDP is not the same as ensuring the well-being of a society.
In truth, “GDP measures everything,” as Senator Robert Kennedy famously said, “except that which makes life worthwhile.” The number does not measure health, education, equality of opportunity, the state of the environment or many other indicators of the quality of life. It does not even measure crucial aspects of the economy such as its sustainability: whether or not it is headed for a crash. What we measure matters, though, because it guides what we do. Americans got an inkling of this causal connection during the Vietnam War, with the military's emphasis on “body counts”: the weekly tabulation of the number of enemy soldiers killed. Reliance on this morbid metric led U.S. forces to undertake operations that had no purpose except to raise the body count. Like a drunk looking for his keys under the lamppost (because that is where the light is), the emphasis on body counts kept us from understanding the bigger picture: the slaughter was inducing more Vietnamese people to join the Viet Cong than U.S. forces were killing.
Now a different body count—that from COVID-19—is proving to be a horribly good measure of societal performance. It has little correlation with GDP. The U.S. is the richest country in the world, with a GDP of more than $20 trillion in 2019, a figure that suggested we had a highly efficient economic engine, a racing car that could outperform any other. But the U.S. recorded upward of 100,000 deaths by June, whereas Vietnam, with a GDP of $262 billion (and a mere 4 percent of U.S. GDP per capita) had zero. In the race to save lives, this less prosperous country has beaten us handily.
In fact, the American economy is more like an ordinary car whose owner saved on gas by removing the spare tire, which was fine until he got a flat. And what I call “GDP thinking”—seeking to boost GDP in the misplaced expectation that that alone would enhance well-being—led us to this predicament. An economy that uses its resources more efficiently in the short term has higher GDP in that quarter or year. Seeking to maximize that macroeconomic measure translates, at a microeconomic level, to each business cutting costs to achieve the highest possible short-term profits. But such a myopic focus necessarily compromises the performance of the economy and society in the long term.
The U.S. health care sector, for example, took pride in using hospital beds efficiently: no bed was left unused. In consequence, when SARS-CoV-2 reached America there were only 2.8 hospital beds per 1,000 people—far fewer than in other advanced countries—and the system could not absorb the sudden surge in patients. Doing without paid sick leave in meat-packing plants increased profits in the short run, which also increased GDP. But workers could not afford to stay home when sick; instead they came to work and spread the infection. Similarly, China made protective masks cheaper than the U.S. could, so importing them increased economic efficiency and GDP. That meant, however, that when the pandemic hit and China needed far more masks than usual, hospital staff in the U.S. could not get enough. In sum, the relentless drive to maximize short-term GDP worsened health care, caused financial and physical insecurity, and reduced economic sustainability and resilience, leaving Americans more vulnerable to shocks than the citizens of other countries.
The shallowness of GDP thinking had already become evident in the 2000s. In preceding decades, European economists, seeing the success of the U.S. in increasing GDP, had encouraged their leaders to follow American-style economic policies. But as signs of distress in the U.S. banking system mounted in 2007, France's President Nicolas Sarkozy realized that any politician who single-mindedly sought to push up GDP to the neglect of other indicators of the quality of life risked losing the confidence of the public. In January 2008 he asked me to chair an international commission on the Measurement of Economic Performance and Social Progress. A panel of experts was to answer the question: How can nations improve their metrics? Measuring that which makes life worthwhile, Sarkozy reasoned, was an essential first step toward enhancing it.
Coincidentally, our initial report in 2009, provocatively entitled Mismeasuring Our Lives: Why GDP Doesn't Add Up, was published right after the global financial crisis had demonstrated the necessity of revisiting the core tenets of economic orthodoxy. It met with such positive resonance that the Organization for Economic Co-operation and Development (OECD)—a think tank that serves 37 advanced countries—decided to follow up with an expert group. After six years of consultation and deliberation, we reinforced and amplified our earlier conclusion: GDP should be dethroned. In its place, each nation should select a “dashboard”—a limited set of metrics that would help steer it toward the future its citizens desired. In addition to GDP itself, as a measure for market activity (and no more) the dashboard would include metrics for health, sustainability and any other values that the people of a nation aspired to, as well as for inequality, insecurity and other harms that they sought to diminish.
These documents have helped crystallize a global movement toward improved measures of social and economic health. The OECD has adopted the approach in its Better Life Initiative, which recommends 11 indicators—and provides citizens with a way to weigh these for their own country, relative to others, to generate an index that measures their performance on the things they care about. The World Bank and the International Monetary Fund (IMF), traditionally strong advocates of GDP thinking, are now also paying attention to environment, inequality and sustainability of the economy.
A few countries have even incorporated this approach into their policy-making frameworks. New Zealand, for instance, embedded “well-being” indicators in the country's budgetary process in 2019. As the country's finance minister, Grant Robertson, put it: “Success is about making New Zealand both a great place to make a living and a great place to make a life.” This emphasis on well-being may partly explain the nation's triumph over COVID-19, which appears to have been eliminated after roughly 1,500 confirmed cases and 20 deaths in a total population of nearly five million.
APPLES AND ARMAMENTS
Necessity is the mother of invention. Just as the dashboard emerged from a dire need—the inadequacy of the GDP as an indicator of well-being, as revealed by the Great Recession of 2008—so did the GDP. During the Great Depression, U.S. officials could barely quantify the problem. The government did not collect statistics on either inflation or unemployment, which would have helped them steer the economy. So the Department of Commerce charged economist Simon Kuznets of the National Bureau of Economic Research with creating a set of national statistics on income. Kuznets went on to construct the GDP in the 1940s as a simple metric that could be calculated from the exceedingly limited market data then available. An aggregate of (the dollar value of) the goods and services produced in the country, it was equivalent to the sum of everyone's income—wages, profits, rents and taxes. For this and other work, he received the Nobel Memorial Prize in Economic Sciences in 1971. (Economist Richard Stone, who created similar statistical systems for the U.K., received the prize in 1984.)
Kuznets repeatedly warned, however, that the GDP only measured market activity and should not be mistaken for a metric of social or even economic well-being. The figure included many goods and services that were harmful (including, he believed, armaments) or useless (financial speculation) and excluded many essential ones that were free (such as caregiving by homemakers). A core difficulty with constructing such an aggregate is that there is no natural unit for adding the value of even apples and oranges, let alone of such disparate things as armaments, financial speculation and caregiving. Thus, economists use their prices as a proxy for value—in the belief that, in a competitive market, prices reflect how much people value apples, oranges, armaments, speculation or caregiving relative to one another.
This profoundly problematic assumption—that price measures relative value—made the GDP quite easy to calculate. As the U.S. recovered from the Depression by ramping up the production and consumption of material goods (in particular, armaments during World War II), GDP grew rapidly. The World Bank and the IMF began to fund development programs in former colonies around the world, gauging their success almost exclusively in terms of GDP growth.

Over time, as economists focused on the intricacies of comparing GDP in different eras and across diverse countries and constructing complex economic models that predicted and explained changes in GDP, they lost sight of the metric's shaky foundations. Students seldom studied the assumptions that went into constructing the measure—and what these assumptions meant for the reliability of any inferences they made. Instead the objective of economic analysis became to explain the movements of this artificial entity. GDP became hegemonic across the globe: good economic policy was taken to be whatever increased GDP the most.
In 1980, following a period of seemingly poor economic performance—stagflation, marked by slow growth and rising prices—President Ronald Reagan assumed office on the promise of ramping up the economy. He deregulated the financial sector and cut taxes for the better-off, arguing that the benefits would “trickle down” to those less fortunate. Although GDP grew somewhat (albeit at a rate markedly lower than in the decades after World War II), inequality rose precipitously. Well aware that metrics matter, some members of the administration reportedly argued for stopping the collection of statistics on inequality. If Americans did not know how bad inequality was, presumably we would not worry about it.
The Reagan administration also unleashed unprecedented assaults on the environment, issuing leases for fossil-fuel extraction on millions of acres of public lands, for example. In 1995 I joined the Council of Economic Advisers for President Bill Clinton. Worrying that our metrics paid too little attention to resource depletion and environmental degradation, we worked with the Department of Commerce to develop a measure of “green” GDP, which would take such losses into account. When the congressional representatives from the coal states got wind of this, however, they threatened to cut off our funding unless we stopped our work, which we were obliged to.
The politicians knew that if Americans understood how bad coal was for our economy correctly measured, then they would seek the elimination of the hidden subsidies that the coal industry receives. And they might even seek to move more quickly to renewables. Although our efforts to broaden our metrics were stymied, the fact that these representatives were willing to spend so much political capital on stopping us convinced me that we were on to something really important. (And it also meant that when, a decade later, Sarkozy approached me about heading an international panel to examine better ways of measuring “economic performance and social progress,” I leaped at the chance.)
I left the Council of Economic Advisers in 1997, and in the ensuing years the deregulatory fervor of the Reagan era came to grip the Clinton administration. The financial sector of the U.S. economy was ballooning, driving up GDP. As it turned out, many of the profits that gave that sector such heft were, in a sense, phony. Bankers' lending practices had generated a real-estate bubble that had artificially enhanced profits—and, with their pay being linked to profits, had increased their bonuses. In the ideal free-market economy, an increase in profits is supposed to reflect an increase in societal well-being, but the bankers' takings put the lie to that notion. Much of their profits resulted from making others worse off, such as when they engaged in abusive credit-card practices or manipulated LIBOR (for London Interbank Offered Rate of interest for international banks lending to one another) to enhance their earnings.
But GDP figures took these inflated figures at face value, convincing policy makers that the best way to grow the economy was to remove any remaining regulations that constrained the finance sector. Long-standing prohibitions on usury—charging outrageous interest rates to take advantage of the unwary—were stripped away. In 2000 the so-called Commodity Modernization Act was passed. It was designed to ensure that derivatives (risky financial products that played a big role in bringing down the financial system just eight years later) would never be regulated. In 2005 a bankruptcy law made it more difficult for those having trouble paying their bills to discharge their debts—making it almost impossible for those with student loans to do so.
By the early 2000s two fifths of corporate profits came from the financial sector. That fraction should have signaled that something was wrong: an efficient financial sector should entail low costs for engaging in financial transactions and therefore should be small. Ours was huge. Untethering the market had inflated profits, driving up GDP—and, as it turned out, instability.
OPIOIDS, HURRICANES
The bubble burst in 2008. Banks had been issuing mortgages indiscriminately, on the assumption that real-estate prices would continue to rise. When the housing bubble broke, so did the economy, falling more than it had since the immediate aftermath of World War II. After the U.S. government rescued the banks (just one firm, AIG, received a government bailout of $130 billion), GDP improved, persuading President Barack Obama and the Federal Reserve to announce that we were well on the way to recovery. But with 91 percent of the gains in income in 2009 to 2012 going to the top 1 percent, the majority of Americans experienced none.
As the country slowly emerged from the financial crisis, others commanded attention: the inequality crisis, the climate crisis and an opioid crisis. Even as GDP continued to rise, life expectancy and other broader measures of health worsened. Food companies were developing and marketing, with great ingenuity, addictive sugar-rich foods, augmenting GDP but precipitating an epidemic of childhood diabetes. Addictive opioids led to an epidemic of drug deaths, but the profits of Purdue Pharma and the other villains in that drama added to GDP. Indeed, the medical expenditures resulting from these health crises also boosted GDP. Americans were spending twice as much per person on health care than the French but had lower life expectancy. So, too, coal mining seemingly boosted the economy, and although it helped to drive climate change, worsening the impact of hurricanes such as Harvey, the efforts to rebuild again added to GDP. The GDP number provided an optimistic gloss to the worst of events.
These examples illustrate the disjuncture between GDP and societal well-being and the many ways that GDP fails to be a good measure of economic performance. The growth in GDP before 2008 was not sustainable, and it was not sustained. The increase in bank profits that seemed to fuel GDP in the years before the crisis were not only at the expense of the well-being of the many people whom the financial sector exploited but also at the expense of GDP in later years. The increase in inequality was by any measure hurting our society, but GDP was celebrating the banks' successes. If there ever was an event that drove home the need for new ways of measuring economic performance and societal progress, the 2008 crisis was it.

THE DASHBOARD
The commission, led by three economists (Amartya Sen of Harvard University, Jean-Paul Fitoussi of the Paris Institute of Political Studies and me), published its first report in 2009, just after the U.S. financial system imploded. We pointed out that measuring something as simple as the fraction of Americans who might have difficulty refinancing their mortgages would have illuminated the smoke and mirrors underpinning the heady economic growth preceding the crisis and possibly enabled policy makers to fend it off. More important, building and paying attention to a broad set of metrics for present-day well-being and its sustainability—whether good times are durable—would help buffer societies against future shocks.
We need to know whether, when GDP is going up, indebtedness is increasing or natural resources are being depleted; these may indicate that the economic growth is not sustainable. If pollution is rising along with GDP, growth is not environmentally sustainable. A good indicator of the true health of an economy is the health of its citizens, and if, as in the U.S., life expectancy has been going down—as it was even before the pandemic—that should be worrying, no matter what is happening to GDP. If median income (that of the families in the middle) is stagnating even as GDP rises, that means the fruits of economic growth are not being shared.
It would have been nice, of course, if we could have come up with a single measure that would summarize how well a society or even an economy is doing—a GDP plus number, say. But as with the GDP itself, too much valuable information is lost when we form an aggregate. Say, you are driving your car. You want to know how fast you are going and glance at the speedometer. It reads 70 miles an hour. And you want to know how far you can go without refilling your tank, which turns out to be 200 miles. Both those numbers are valuable, conveying information that could affect your behavior. But now assume you form a simple aggregate by adding up the two numbers, with or without “weights.” What would a number like 270 tell you? Absolutely nothing. It would not tell you whether you are driving recklessly or how worried you should be about running out of fuel.
That was why we concluded that each nation needs a dashboard—a set of numbers that would convey essential diagnostics of its society and economy and help steer them. Policy makers and civil-society groups should pay attention not only to material wealth but also to health, education, leisure, environment, equality, governance, political voice, social connectedness, physical and economic security, and other indicators of the quality of life. Just as important, societies must ensure that these “goods” are not bought at the expense of the future. To that end, they should focus on maintaining and augmenting, to the extent possible, their stocks of natural, human, social and physical capital. We also laid out a research agenda for exploring links between the different components of well-being and sustainability and developing good ways to measure them.
Concern about climate change and rising inequality had already been fueling a global demand for better measures, and our report crystallized that trend. In 2015 a contentious political process culminated in the United Nations establishing a set of 17 Sustainable Development Goals. Progress toward them is to be measured by 232 indicators, reflecting the manifold concerns of governments and civil societies from around the world. So many numbers are unhelpful, in our view: one can lose sight of the forest for the trees. Instead another group of experts, chaired by Fitoussi, Martine Durand (chief statistician of the OECD) and me, recommended that each country institute a robust democratic dialogue to discover what issues its citizens most care about.
Such a conversation would almost certainly show that most of us who live in highly developed economies care about our material well-being, our health, the environment around us and our relations with others. We want to do well today but also in the future. We care about how the fruits of our economy are shared: we do not want a society in which a few at the top grab everything for themselves and the rest live in poverty.
A good indicator of the true health of an economy is the health of its citizens. A decline in life expectancy, even for a part of the population, should be worrying, whatever is happening to GDP. And it is important to know if, even as GDP is going up, so, too, is pollution—whether it is emissions of greenhouse gases or particulates in the air. That means growth is not environmentally sustainable.
The choice of indicators may vary across time and among countries. Countries with high unemployment will want to track what is happening to that variable; those with high inequality will want to monitor that. Still, because people generally want to know how they are doing in comparison with others, we recommended that the advanced countries, at least, share some five to 10 common indicators.
GDP would be among them. So would a measure of inequality or some pointer toward how the typical individual or household is doing. Over the years economists have formulated a rash of indicators of inequality, each reflecting a different dimension of the phenomenon. It may well be that societies where inequality has become particularly problematic may need to have metrics reflecting the depth of the poverty at the bottom and the excesses of riches at the top. To me, knowing what is happening to median income is of particular importance; in the U.S., median income has barely changed for decades, even as GDP has grown.
Employment is often used as an indicator of macroeconomic performance—an economy with a high unemployment rate clearly is not using all of its resources well. But in societies where paid work is associated with dignity, employment is a value in its own right. Other elements of the dashboard would include indicators for environmental degradation (say, air or water quality), economic sustainability (indebtedness), health (life expectancy) and insecurity.
Insecurity has both subjective and objective dimensions. We can survey how insecure people feel: how worried they are about adverse effects or how prepared they feel to cope with a shock. But we can also predict the likelihood that someone falls below the poverty line in any given year. And some elements of the dashboard are “intermediate” variables—things that we may (or may not) value in themselves but that provide an inkling of how a society will function in the future. One of these is trust. Societies in which citizens trust their governments and one another to “do the right thing” tend to perform better. In fact, societies in which people have higher levels of trust, such as Vietnam and New Zealand, have dealt far more effectively with the pandemic than the U.S., for instance, where trust levels have declined since the Reagan era.
Policy makers need to use such indicators much as physicians use their diagnostic tools. When some indicator is flashing yellow or red, it is time to look deeper. If inequality is high or increasing, it is important to know more: What aspects of inequality are getting worse?
STEERING THROUGH STORMS
Since we began our work on well-being indicators some dozen years ago, I have been amazed at the resonance that it has achieved. A focus on many of the elements of the dashboard has permeated policy making everywhere. Every three years the OECD hosts an international conference of nongovernmental organizations, national statisticians, government officials and academics furthering the “well-being” agenda, the most recent being in Korea in November 2018, with thousands of participants.
Whenever the conference next convenes, the global crisis in human societies that a microscopic virus has precipitated will surely be on the agenda. The full dimensions of it could take years or decades to become clear. Recovering from this calamity and steering complex societies through the even more devastating crises that loom—catastrophic climate change and biodiversity collapse—will require, at the very least, an excellent navigational system. To paraphrase the OECD: We have been developing the tools to help us drive better. It is time to use them.


