Search This Blog

Showing posts with label measure. Show all posts

Saturday 1 August 2020

GDP Is the Wrong Tool for Measuring What Matters

Joseph E Stiglitz in Scientific American

Since World War II, most countries around the world have come to use gross domestic product, or GDP, as the core metric for prosperity. The GDP measures market output: the monetary value of all the goods and services produced in an economy during a given period, usually a year. Governments can fail if this number falls—and so, not surprisingly, governments strive to make it climb. But striving to grow GDP is not the same as ensuring the well-being of a society.
In truth, “GDP measures everything,” as Senator Robert Kennedy famously said, “except that which makes life worthwhile.” The number does not measure health, education, equality of opportunity, the state of the environment or many other indicators of the quality of life. It does not even measure crucial aspects of the economy such as its sustainability: whether or not it is headed for a crash. What we measure matters, though, because it guides what we do. Americans got an inkling of this causal connection during the Vietnam War, with the military's emphasis on “body counts”: the weekly tabulation of the number of enemy soldiers killed. Reliance on this morbid metric led U.S. forces to undertake operations that had no purpose except to raise the body count. Like a drunk looking for his keys under the lamppost (because that is where the light is), the emphasis on body counts kept us from understanding the bigger picture: the slaughter was inducing more Vietnamese people to join the Viet Cong than U.S. forces were killing.
Now a different body count—that from COVID-19—is proving to be a horribly good measure of societal performance. It has little correlation with GDP. The U.S. is the richest country in the world, with a GDP of more than $20 trillion in 2019, a figure that suggested we had a highly efficient economic engine, a racing car that could outperform any other. But the U.S. recorded upward of 100,000 deaths by June, whereas Vietnam, with a GDP of $262 billion (and a mere 4 percent of U.S. GDP per capita) had zero. In the race to save lives, this less prosperous country has beaten us handily.
In fact, the American economy is more like an ordinary car whose owner saved on gas by removing the spare tire, which was fine until he got a flat. And what I call “GDP thinking”—seeking to boost GDP in the misplaced expectation that that alone would enhance well-being—led us to this predicament. An economy that uses its resources more efficiently in the short term has higher GDP in that quarter or year. Seeking to maximize that macroeconomic measure translates, at a microeconomic level, to each business cutting costs to achieve the highest possible short-term profits. But such a myopic focus necessarily compromises the performance of the economy and society in the long term.
The U.S. health care sector, for example, took pride in using hospital beds efficiently: no bed was left unused. In consequence, when SARS-CoV-2 reached America there were only 2.8 hospital beds per 1,000 people—far fewer than in other advanced countries—and the system could not absorb the sudden surge in patients. Doing without paid sick leave in meat-packing plants increased profits in the short run, which also increased GDP. But workers could not afford to stay home when sick; instead they came to work and spread the infection. Similarly, China made protective masks cheaper than the U.S. could, so importing them increased economic efficiency and GDP. That meant, however, that when the pandemic hit and China needed far more masks than usual, hospital staff in the U.S. could not get enough. In sum, the relentless drive to maximize short-term GDP worsened health care, caused financial and physical insecurity, and reduced economic sustainability and resilience, leaving Americans more vulnerable to shocks than the citizens of other countries.
The shallowness of GDP thinking had already become evident in the 2000s. In preceding decades, European economists, seeing the success of the U.S. in increasing GDP, had encouraged their leaders to follow American-style economic policies. But as signs of distress in the U.S. banking system mounted in 2007, France's President Nicolas Sarkozy realized that any politician who single-mindedly sought to push up GDP to the neglect of other indicators of the quality of life risked losing the confidence of the public. In January 2008 he asked me to chair an international commission on the Measurement of Economic Performance and Social Progress. A panel of experts was to answer the question: How can nations improve their metrics? Measuring that which makes life worthwhile, Sarkozy reasoned, was an essential first step toward enhancing it.
Coincidentally, our initial report in 2009, provocatively entitled Mismeasuring Our Lives: Why GDP Doesn't Add Up, was published right after the global financial crisis had demonstrated the necessity of revisiting the core tenets of economic orthodoxy. It met with such positive resonance that the Organization for Economic Co-operation and Development (OECD)—a think tank that serves 37 advanced countries—decided to follow up with an expert group. After six years of consultation and deliberation, we reinforced and amplified our earlier conclusion: GDP should be dethroned. In its place, each nation should select a “dashboard”—a limited set of metrics that would help steer it toward the future its citizens desired. In addition to GDP itself, as a measure for market activity (and no more) the dashboard would include metrics for health, sustainability and any other values that the people of a nation aspired to, as well as for inequality, insecurity and other harms that they sought to diminish.
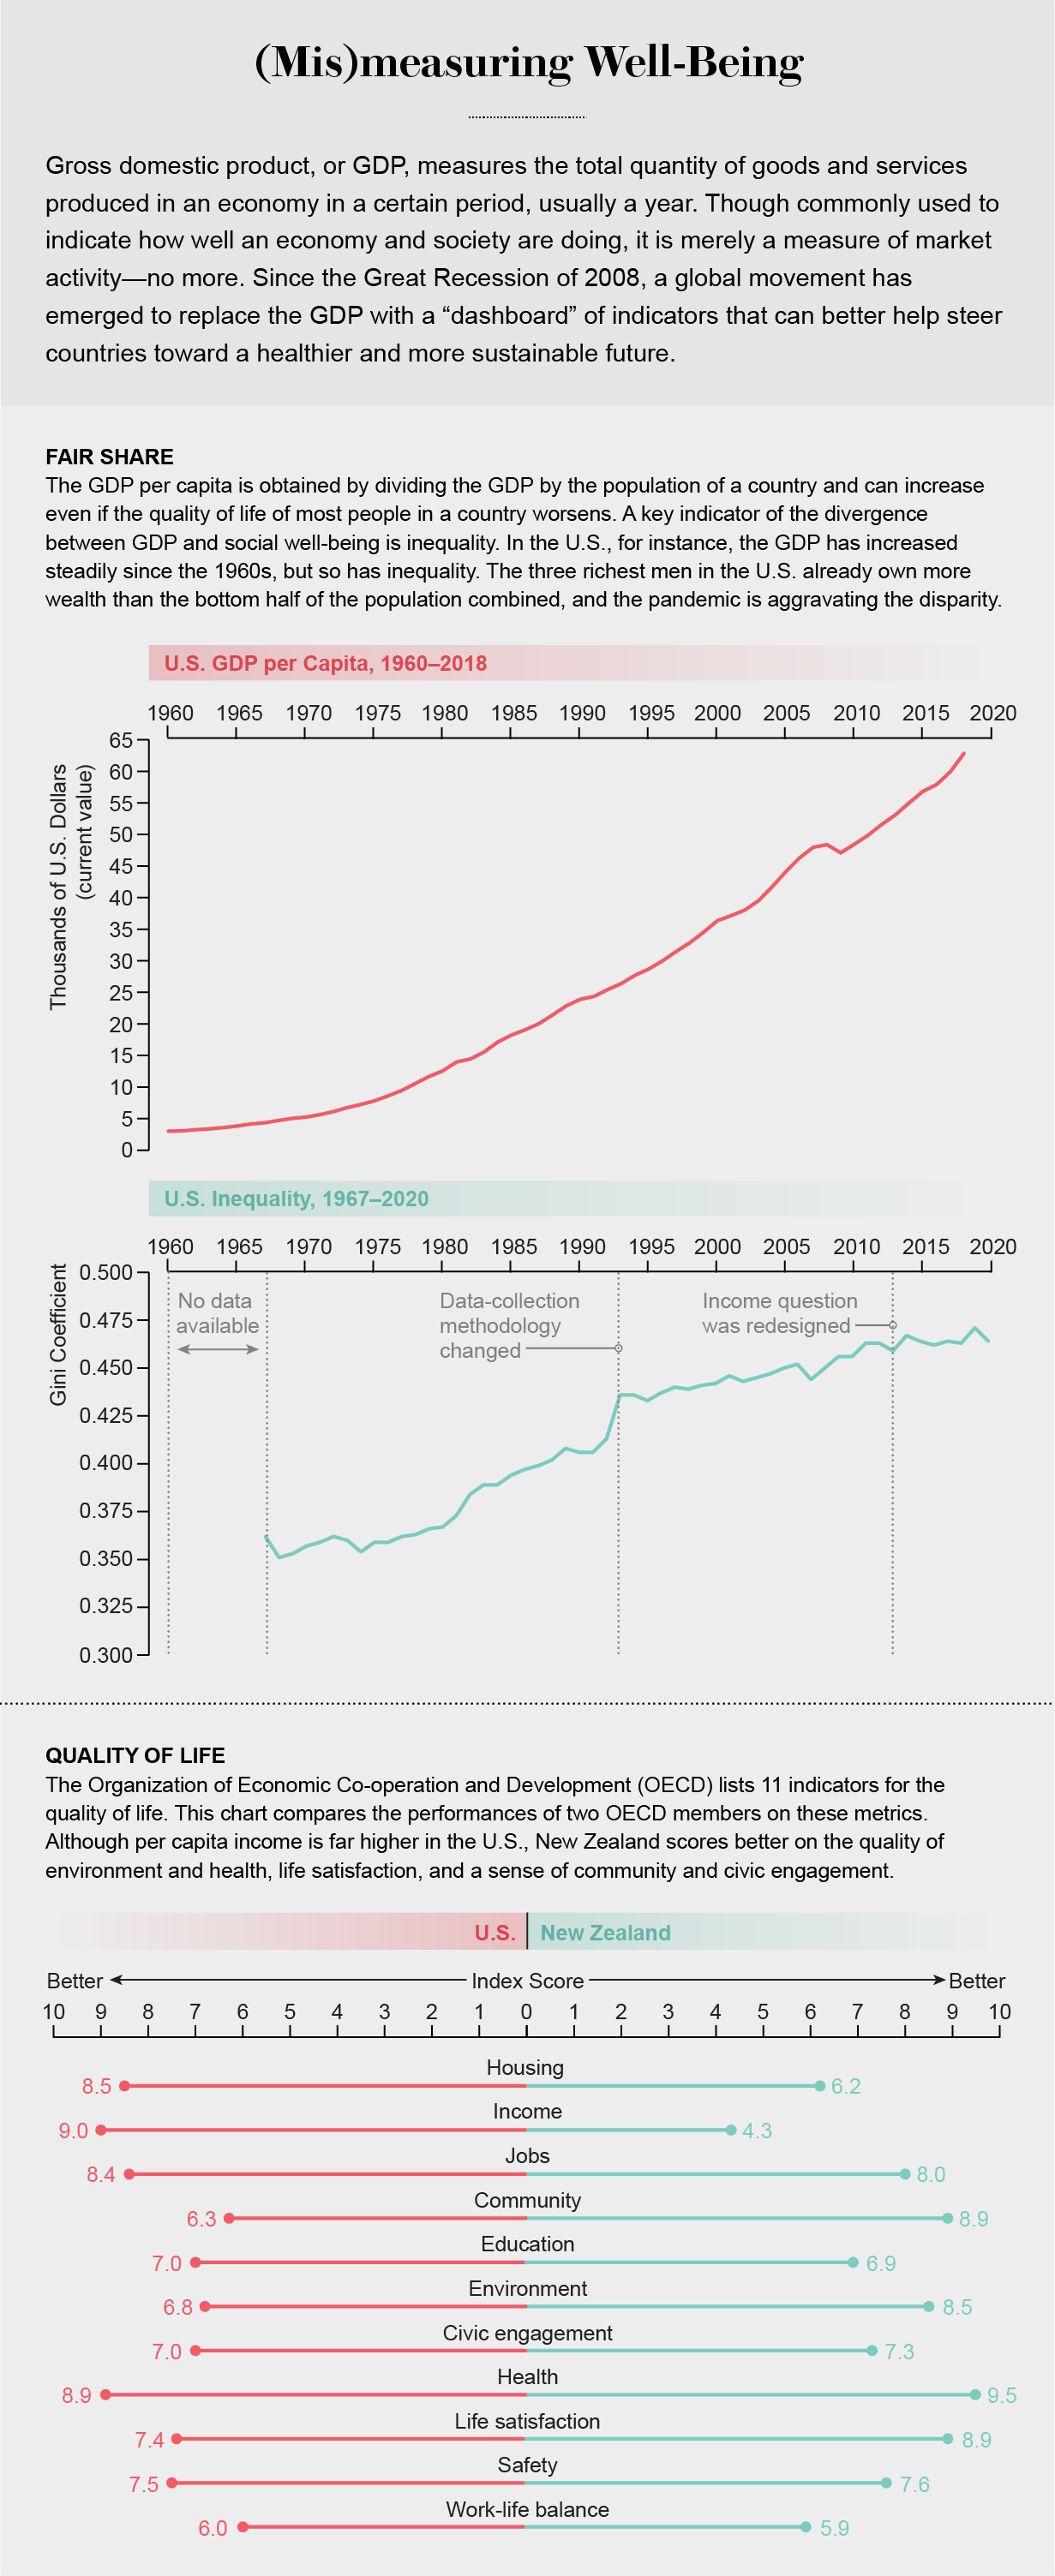
These documents have helped crystallize a global movement toward improved measures of social and economic health. The OECD has adopted the approach in its Better Life Initiative, which recommends 11 indicators—and provides citizens with a way to weigh these for their own country, relative to others, to generate an index that measures their performance on the things they care about. The World Bank and the International Monetary Fund (IMF), traditionally strong advocates of GDP thinking, are now also paying attention to environment, inequality and sustainability of the economy.
A few countries have even incorporated this approach into their policy-making frameworks. New Zealand, for instance, embedded “well-being” indicators in the country's budgetary process in 2019. As the country's finance minister, Grant Robertson, put it: “Success is about making New Zealand both a great place to make a living and a great place to make a life.” This emphasis on well-being may partly explain the nation's triumph over COVID-19, which appears to have been eliminated after roughly 1,500 confirmed cases and 20 deaths in a total population of nearly five million.

APPLES AND ARMAMENTS

Necessity is the mother of invention. Just as the dashboard emerged from a dire need—the inadequacy of the GDP as an indicator of well-being, as revealed by the Great Recession of 2008—so did the GDP. During the Great Depression, U.S. officials could barely quantify the problem. The government did not collect statistics on either inflation or unemployment, which would have helped them steer the economy. So the Department of Commerce charged economist Simon Kuznets of the National Bureau of Economic Research with creating a set of national statistics on income. Kuznets went on to construct the GDP in the 1940s as a simple metric that could be calculated from the exceedingly limited market data then available. An aggregate of (the dollar value of) the goods and services produced in the country, it was equivalent to the sum of everyone's income—wages, profits, rents and taxes. For this and other work, he received the Nobel Memorial Prize in Economic Sciences in 1971. (Economist Richard Stone, who created similar statistical systems for the U.K., received the prize in 1984.)
Kuznets repeatedly warned, however, that the GDP only measured market activity and should not be mistaken for a metric of social or even economic well-being. The figure included many goods and services that were harmful (including, he believed, armaments) or useless (financial speculation) and excluded many essential ones that were free (such as caregiving by homemakers). A core difficulty with constructing such an aggregate is that there is no natural unit for adding the value of even apples and oranges, let alone of such disparate things as armaments, financial speculation and caregiving. Thus, economists use their prices as a proxy for value—in the belief that, in a competitive market, prices reflect how much people value apples, oranges, armaments, speculation or caregiving relative to one another.
This profoundly problematic assumption—that price measures relative value—made the GDP quite easy to calculate. As the U.S. recovered from the Depression by ramping up the production and consumption of material goods (in particular, armaments during World War II), GDP grew rapidly. The World Bank and the IMF began to fund development programs in former colonies around the world, gauging their success almost exclusively in terms of GDP growth.
GDP vs Quality of life chart
Sources: World Bank (GDP data); U.S. Census Bureau (inequality data); Organization for Economic Co-operation and Development (Better Life Index data)
Over time, as economists focused on the intricacies of comparing GDP in different eras and across diverse countries and constructing complex economic models that predicted and explained changes in GDP, they lost sight of the metric's shaky foundations. Students seldom studied the assumptions that went into constructing the measure—and what these assumptions meant for the reliability of any inferences they made. Instead the objective of economic analysis became to explain the movements of this artificial entity. GDP became hegemonic across the globe: good economic policy was taken to be whatever increased GDP the most.
In 1980, following a period of seemingly poor economic performance—stagflation, marked by slow growth and rising prices—President Ronald Reagan assumed office on the promise of ramping up the economy. He deregulated the financial sector and cut taxes for the better-off, arguing that the benefits would “trickle down” to those less fortunate. Although GDP grew somewhat (albeit at a rate markedly lower than in the decades after World War II), inequality rose precipitously. Well aware that metrics matter, some members of the administration reportedly argued for stopping the collection of statistics on inequality. If Americans did not know how bad inequality was, presumably we would not worry about it.
The Reagan administration also unleashed unprecedented assaults on the environment, issuing leases for fossil-fuel extraction on millions of acres of public lands, for example. In 1995 I joined the Council of Economic Advisers for President Bill Clinton. Worrying that our metrics paid too little attention to resource depletion and environmental degradation, we worked with the Department of Commerce to develop a measure of “green” GDP, which would take such losses into account. When the congressional representatives from the coal states got wind of this, however, they threatened to cut off our funding unless we stopped our work, which we were obliged to.
The politicians knew that if Americans understood how bad coal was for our economy correctly measured, then they would seek the elimination of the hidden subsidies that the coal industry receives. And they might even seek to move more quickly to renewables. Although our efforts to broaden our metrics were stymied, the fact that these representatives were willing to spend so much political capital on stopping us convinced me that we were on to something really important. (And it also meant that when, a decade later, Sarkozy approached me about heading an international panel to examine better ways of measuring “economic performance and social progress,” I leaped at the chance.)
I left the Council of Economic Advisers in 1997, and in the ensuing years the deregulatory fervor of the Reagan era came to grip the Clinton administration. The financial sector of the U.S. economy was ballooning, driving up GDP. As it turned out, many of the profits that gave that sector such heft were, in a sense, phony. Bankers' lending practices had generated a real-estate bubble that had artificially enhanced profits—and, with their pay being linked to profits, had increased their bonuses. In the ideal free-market economy, an increase in profits is supposed to reflect an increase in societal well-being, but the bankers' takings put the lie to that notion. Much of their profits resulted from making others worse off, such as when they engaged in abusive credit-card practices or manipulated LIBOR (for London Interbank Offered Rate of interest for international banks lending to one another) to enhance their earnings.
But GDP figures took these inflated figures at face value, convincing policy makers that the best way to grow the economy was to remove any remaining regulations that constrained the finance sector. Long-standing prohibitions on usury—charging outrageous interest rates to take advantage of the unwary—were stripped away. In 2000 the so-called Commodity Modernization Act was passed. It was designed to ensure that derivatives (risky financial products that played a big role in bringing down the financial system just eight years later) would never be regulated. In 2005 a bankruptcy law made it more difficult for those having trouble paying their bills to discharge their debts—making it almost impossible for those with student loans to do so.
By the early 2000s two fifths of corporate profits came from the financial sector. That fraction should have signaled that something was wrong: an efficient financial sector should entail low costs for engaging in financial transactions and therefore should be small. Ours was huge. Untethering the market had inflated profits, driving up GDP—and, as it turned out, instability.

OPIOIDS, HURRICANES

The bubble burst in 2008. Banks had been issuing mortgages indiscriminately, on the assumption that real-estate prices would continue to rise. When the housing bubble broke, so did the economy, falling more than it had since the immediate aftermath of World War II. After the U.S. government rescued the banks (just one firm, AIG, received a government bailout of $130 billion), GDP improved, persuading President Barack Obama and the Federal Reserve to announce that we were well on the way to recovery. But with 91 percent of the gains in income in 2009 to 2012 going to the top 1 percent, the majority of Americans experienced none.
As the country slowly emerged from the financial crisis, others commanded attention: the inequality crisis, the climate crisis and an opioid crisis. Even as GDP continued to rise, life expectancy and other broader measures of health worsened. Food companies were developing and marketing, with great ingenuity, addictive sugar-rich foods, augmenting GDP but precipitating an epidemic of childhood diabetes. Addictive opioids led to an epidemic of drug deaths, but the profits of Purdue Pharma and the other villains in that drama added to GDP. Indeed, the medical expenditures resulting from these health crises also boosted GDP. Americans were spending twice as much per person on health care than the French but had lower life expectancy. So, too, coal mining seemingly boosted the economy, and although it helped to drive climate change, worsening the impact of hurricanes such as Harvey, the efforts to rebuild again added to GDP. The GDP number provided an optimistic gloss to the worst of events.
These examples illustrate the disjuncture between GDP and societal well-being and the many ways that GDP fails to be a good measure of economic performance. The growth in GDP before 2008 was not sustainable, and it was not sustained. The increase in bank profits that seemed to fuel GDP in the years before the crisis were not only at the expense of the well-being of the many people whom the financial sector exploited but also at the expense of GDP in later years. The increase in inequality was by any measure hurting our society, but GDP was celebrating the banks' successes. If there ever was an event that drove home the need for new ways of measuring economic performance and societal progress, the 2008 crisis was it.
GDP abstract art
Credit: Samantha Mash

THE DASHBOARD

The commission, led by three economists (Amartya Sen of Harvard University, Jean-Paul Fitoussi of the Paris Institute of Political Studies and me), published its first report in 2009, just after the U.S. financial system imploded. We pointed out that measuring something as simple as the fraction of Americans who might have difficulty refinancing their mortgages would have illuminated the smoke and mirrors underpinning the heady economic growth preceding the crisis and possibly enabled policy makers to fend it off. More important, building and paying attention to a broad set of metrics for present-day well-being and its sustainability—whether good times are durable—would help buffer societies against future shocks.
We need to know whether, when GDP is going up, indebtedness is increasing or natural resources are being depleted; these may indicate that the economic growth is not sustainable. If pollution is rising along with GDP, growth is not environmentally sustainable. A good indicator of the true health of an economy is the health of its citizens, and if, as in the U.S., life expectancy has been going down—as it was even before the pandemic—that should be worrying, no matter what is happening to GDP. If median income (that of the families in the middle) is stagnating even as GDP rises, that means the fruits of economic growth are not being shared.
It would have been nice, of course, if we could have come up with a single measure that would summarize how well a society or even an economy is doing—a GDP plus number, say. But as with the GDP itself, too much valuable information is lost when we form an aggregate. Say, you are driving your car. You want to know how fast you are going and glance at the speedometer. It reads 70 miles an hour. And you want to know how far you can go without refilling your tank, which turns out to be 200 miles. Both those numbers are valuable, conveying information that could affect your behavior. But now assume you form a simple aggregate by adding up the two numbers, with or without “weights.” What would a number like 270 tell you? Absolutely nothing. It would not tell you whether you are driving recklessly or how worried you should be about running out of fuel.
That was why we concluded that each nation needs a dashboard—a set of numbers that would convey essential diagnostics of its society and economy and help steer them. Policy makers and civil-society groups should pay attention not only to material wealth but also to health, education, leisure, environment, equality, governance, political voice, social connectedness, physical and economic security, and other indicators of the quality of life. Just as important, societies must ensure that these “goods” are not bought at the expense of the future. To that end, they should focus on maintaining and augmenting, to the extent possible, their stocks of natural, human, social and physical capital. We also laid out a research agenda for exploring links between the different components of well-being and sustainability and developing good ways to measure them.
Concern about climate change and rising inequality had already been fueling a global demand for better measures, and our report crystallized that trend. In 2015 a contentious political process culminated in the United Nations establishing a set of 17 Sustainable Development Goals. Progress toward them is to be measured by 232 indicators, reflecting the manifold concerns of governments and civil societies from around the world. So many numbers are unhelpful, in our view: one can lose sight of the forest for the trees. Instead another group of experts, chaired by Fitoussi, Martine Durand (chief statistician of the OECD) and me, recommended that each country institute a robust democratic dialogue to discover what issues its citizens most care about.
Such a conversation would almost certainly show that most of us who live in highly developed economies care about our material well-being, our health, the environment around us and our relations with others. We want to do well today but also in the future. We care about how the fruits of our economy are shared: we do not want a society in which a few at the top grab everything for themselves and the rest live in poverty.
A good indicator of the true health of an economy is the health of its citizens. A decline in life expectancy, even for a part of the population, should be worrying, whatever is happening to GDP. And it is important to know if, even as GDP is going up, so, too, is pollution—whether it is emissions of greenhouse gases or particulates in the air. That means growth is not environmentally sustainable.
The choice of indicators may vary across time and among countries. Countries with high unemployment will want to track what is happening to that variable; those with high inequality will want to monitor that. Still, because people generally want to know how they are doing in comparison with others, we recommended that the advanced countries, at least, share some five to 10 common indicators.
GDP would be among them. So would a measure of inequality or some pointer toward how the typical individual or household is doing. Over the years economists have formulated a rash of indicators of inequality, each reflecting a different dimension of the phenomenon. It may well be that societies where inequality has become particularly problematic may need to have metrics reflecting the depth of the poverty at the bottom and the excesses of riches at the top. To me, knowing what is happening to median income is of particular importance; in the U.S., median income has barely changed for decades, even as GDP has grown.
Employment is often used as an indicator of macroeconomic performance—an economy with a high unemployment rate clearly is not using all of its resources well. But in societies where paid work is associated with dignity, employment is a value in its own right. Other elements of the dashboard would include indicators for environmental degradation (say, air or water quality), economic sustainability (indebtedness), health (life expectancy) and insecurity.
Insecurity has both subjective and objective dimensions. We can survey how insecure people feel: how worried they are about adverse effects or how prepared they feel to cope with a shock. But we can also predict the likelihood that someone falls below the poverty line in any given year. And some elements of the dashboard are “intermediate” variables—things that we may (or may not) value in themselves but that provide an inkling of how a society will function in the future. One of these is trust. Societies in which citizens trust their governments and one another to “do the right thing” tend to perform better. In fact, societies in which people have higher levels of trust, such as Vietnam and New Zealand, have dealt far more effectively with the pandemic than the U.S., for instance, where trust levels have declined since the Reagan era.
Policy makers need to use such indicators much as physicians use their diagnostic tools. When some indicator is flashing yellow or red, it is time to look deeper. If inequality is high or increasing, it is important to know more: What aspects of inequality are getting worse?

STEERING THROUGH STORMS

Since we began our work on well-being indicators some dozen years ago, I have been amazed at the resonance that it has achieved. A focus on many of the elements of the dashboard has permeated policy making everywhere. Every three years the OECD hosts an international conference of nongovernmental organizations, national statisticians, government officials and academics furthering the “well-being” agenda, the most recent being in Korea in November 2018, with thousands of participants.
Whenever the conference next convenes, the global crisis in human societies that a microscopic virus has precipitated will surely be on the agenda. The full dimensions of it could take years or decades to become clear. Recovering from this calamity and steering complex societies through the even more devastating crises that loom—catastrophic climate change and biodiversity collapse—will require, at the very least, an excellent navigational system. To paraphrase the OECD: We have been developing the tools to help us drive better. It is time to use them.

Monday 17 September 2018

The limits of using GDP

Keya Acharya in The Wire.In


Most countries swear by it. It is cited by newspapers, banks and business. Almost all prominent world political leaders have used the GDP (gross domestic product) to show their countries’ well-being. Prime Minister Narendra Modi and finance minister Arun Jaitley repeatedly use India’s apparently rising GDP to point to the country’s progress and as a defence tool against criticism.

GDP measures the monetary value of goods and services produced by a country, mostly for sale in markets. Though the concept had earlier beginnings, national income and a nation’s products were first created by American Nobel laureate Simon Kuznets of the US Department of Commerce in 1934, born due to the information gaps that led to the Great Depression.

By the 1940s, wartime planning led John Maynard Keynes of the British Treasury and Henry Morgenthau Jr. of the US Treasury to go further and develop the metric of measurement we now know as GDP.

The question now is, is the concept still relevant in today’s situation? There have been criticisms for decades, from prominent economists and academics, that GDP is inadequate in measuring development, not least of all by Nobel laureate Joseph Stiglitz together with Amartya Sen and Jean-Paul Fitoussi in their 2010 report Mismeasuring our Lives: Why GDP Doesn’t Add Up.

Stiglitz, Sen et al say that statistical concepts in GDP may be correct, but the system is fundamentally flawed in that is does not measure a country’s income distribution or the well-being of its citizens. They take the case of traffic jams (page 3 of their book’s summary) as an example: GDP may rise because of increased sale of cars and gasoline but does not take into account the impact of the overuse of these on the quality of life.

The case of Delhi’s air pollution, and its major connection to its use of diesel could well be an example for us. Six years ago, a World Bank report put India’s costs of air pollution and environmental destruction at $80 billion per year; the costs could well have increased in the intervening years. Stiglitz, Sen themselves have said that statistical measures which ignore air pollution will be an inaccurate estimate of citizen’s well-being.

Indeed, even Simon Kuznets, the original founder, had said over fifty years ago that to assess a nation’s welfare, economists need to ask not how much the economy is growing, but what is growing and for whom, points out Canadian political scientist Ronald Colman (co-architect of Bhutan’s Gross National Happiness index).

Robert Costanza of Australian National University says GDP ignores social costs, environmental degradation, income-inequality, something even the OECD’s (Organisation for Economic Co-operation and Development) head of national accounts, Francois Lequiller concurs.

The WEF has a new term called inclusive development index, to measure a country’s progress. In January 2018, India ranked 62nd out of 74 emerging economies in its development index, beaten by Sri Lanka, Nepal and Pakistan in its region for development progress.

Colman outlines the enormous failure of the GDP to account for the accelerating trends of resource depletion, species extinctions and increasing greenhouse gas emissions. The last 12 years have been the hottest in millennia; sea-levels will rise by a metre by 2100; forests have been decimated and overhunted, disappearing by 1% per year whilst 40% of the world’s tropical forests have already disappeared, he says. The impacts of these existing threats do not reflect in the GDP.

And yet, in spite of this wide array of prominent criticism by noted scholars, an alternative index of economic and overall well-being has not become mainstream. Stiglitz and Sen’s economic critique was commissioned by French President Nicholas Sarkozy in 2009; yet the 2015 Paris Agreement, signed in France and deemed a milestone in the global agreement on climate change mitigation measures by 195 countries, has no inclusion of anything that offers an alternative GDP system.

At an international gathering of journalists in Italy, late November 2017, which saw a panel of economic experts from around the world discussing alternative GDP issues, I asked American physicist Fritjof Capra, director of the Centre for Ecoliteracy at Berkeley, US, why there was such a gaping lack of the inclusion of alternative GDP measures in the Paris Agreement. Capra believed that the lack of civil society participation in this particular field was a major reason for its absence. Costanza said that the habit was hard to kick, equating the GDP system to an ‘addiction’, difficult to erase.

Colman believes the fundamental reason for an alternative measurement system not finding its rightful place is that it ‘threatens the short-term economic base’: “This is unpalatable in the political arena; who is willing to challenge this?” he asks. He does agree that civil society needs to be far more engaged to displace GDP as fundamental to measuring a country’s progress.

Costanza has looked at the UN’s 17 Sustainable Development Goals (SDGs) as an alternative system. The SDGs however, are not compulsory policy practice, merely a persuasion for nations to follow. They are also complex in their interrelatedness, making it all the more difficult to present as a binding guideline. Integrating some of these development measures into the current GDP system is not possible, says Colman.

The complexity is indeed enormous, which is one reason for there not being any unity amongst economists in pushing what should be a crucial system for gauging development.

Obviously then, we need to make ecological and development economics a compulsory, system for nations to follow. Some have already done it (New Zealand, Bhutan, UK; China has re-started green growth research). It needs political will and push.

Governments might well find their own interests served in moving to an alternative GDP and striking out on a new path.

Friday 5 January 2018

The case against GDP

David Pilling in The Financial Times

Imagine two people. Let’s call them Bill and Ben. Bill is a mid-ranking investment banker who clears £500,000 a year after tax. Ben is a gardener who takes home £25,000. Who is better off? 


If we judge them by their income, then Bill is clearly richer; 20 times richer, to be precise. But who is wealthier? For that, you’re going to have to know more about their stock of assets and broader circumstances. 

In national accounting terms, Bill’s £500,000 salary is the equivalent of gross domestic product. It is the “flow” of income earned in a year. But, as any mortgage lender knows, that doesn’t tell you anything about his wealth or his salary next year or the year after that. 

Did I mention that Bill is up to his neck in debt after a crippling divorce, or that he has an expensive cocaine habit? He’s sold off most of his assets, including his vintage Harley-Davidsons. All he is left with is a costly mortgage and several payments on his (scratched-up) Porsche. At 59, he’s also washed up at work. In fact, he is about to be fired when the bank shifts its derivatives trading team from London to Frankfurt. 

Ben, meanwhile, lives in the £100m country estate he inherited from his great aunt. On the weekends, he potters about for fun in his own Versailles-inspired garden, paying himself a nominal salary. 

This year, before he turns 21, he plans to sell the estate and move into a modest flat in Knightsbridge. He’ll invest the £95m he has left over and live off the interest while he completes his studies as a patent lawyer, a profession that should earn him a bit of pocket money in the years ahead. 

Michal Kalecki, the Polish economist, is said to have described economics as “the science of confusing stocks with flows”. Investors scrutinise a company’s balance sheet as well as its profits and losses. Yet, when it comes to sizing up a nation, we are mostly stuck with GDP, which counts the value of goods and services produced in a given period. 

GDP numbers can be misleading. That applies especially to resource-rich countries. Saudi Arabia’s income per capita of around $20,000 a year depends on the price and production volume of oil, which will one day run out. At that point, unless the Saudis figure out a way of replacing lost income — through developing high-tech industries staffed by educated people — it will become the Bill the banker of nations. 

As Paul Collier, professor of economics and public policy at the Blavatnik School of Government, says, it is a lesson hard to glean from national income statistics. You need regular updates of a country’s balance sheet to “blow the whistle” on unsustainable policies. 

Yet it is not something lost on astute leaders. Much of the urgency behind the reform efforts of Mohammed bin Salman, Saudi’s 32-year-old crown prince, stems from an apparent determination to diversify the economy before it is too late. 

“Policies that create wealth go beyond increasing output,” say Kirk Hamilton and Cameron Hepburn, in their recent book National Wealth: What is Missing, Why it Matters. “They involve investments today for returns in the future.” 

I have long had vague misgivings about GDP as an accurate barometer of living standards and the sustainability of wealth. As a young reporter for the FT in Latin America in the 1990s, I quickly learnt to report minutely on the quarterly gyrations of GDP and to lend my articles a touch of gravitas by deploying GDP as a denominator. Tax revenue or debt levels or education expenditure were best expressed as a percentage of GDP to facilitate cross-country comparisons. Yet beyond knowing that GDP was a measure of economic output, I never stopped to think exactly how it was calculated or precisely what it meant.

Later, as a correspondent in Japan, I wondered why people seemed so well off when nominal GDP had not budged for 20 years. Deflation and low population growth were part of the answer. That meant real per capita income was higher than the nominal number suggested. But the quality of services and technology also made a difference to living standards. To GDP, an elegant Mitsukoshi department store was the same as a Walmart, and a clapped-out British commuter train did just as well as a Japanese Shinkansen travelling at 200mph and arriving with a punctuality measured in fractions of a second. 

Later still, in China, I marvelled at year after year of double-digit growth, but worried that no one was taking any statistical reckoning of the not-so-hidden costs of growth in poisoned air and depleted soil. It seemed perverse that, if China spent money cleaning up its mess, that too would count as growth, much as GDP counts money spent to repair the damage after natural disasters, terrorist attacks or war. Any activity, it seemed — digging a hole and filling it up again — would do. 

In my most recent job, as Africa editor, I discovered that GDP data — often treated as sacrosanct and used, for example, to determine appropriate levels of borrowing — were virtually meaningless. Normal methods of compiling GDP, which rely on costly surveys of businesses and households, were often too expensive for cash-strapped governments to undertake. Besides, they failed to account properly for activity in the massive informal and subsistence sectors. Terry Ryan, chairman of Kenya’s National Bureau of Statistics, told me that if — as the official data suggested — some 72 per cent of Kenyans lived on a dollar or two a day, then “72 per cent of my people are dead”. 

In Nigeria, minor changes to methodology implemented in 2014 revealed that the economy was 89 per cent bigger than assumed, making a mockery of previous estimates. Again in Kenya, one group of economists said they could monitor the economy more accurately than GDP from outer space. Satellite imagery of night-lights showed that national income statistics were missing swathes of activity outside Nairobi, the capital. 

As I began to read more in the course of researching a book, The Growth Delusion, I found that I was far from alone in my scepticism. There was a whole academic literature, a mini-industry becoming more respectable by the day, questioning the ability of GDP to reflect our lives. 

Invented in the 1930s by Simon Kuznets, initially as a way of calculating the damage wrought by the Great Depression, GDP is a child of the manufacturing age. Good at keeping track of “things you can drop on your foot”, it struggles to make sense of the services — from life insurance and landscape gardening to stand-up comedy — that comprise some 80 per cent of modern economies. The internet is more perplexing still. In GDP terms, Wikipedia, which puts the sum of human knowledge at our fingertips, is worth precisely nothing. 

Nor does GDP have much useful to say about income distribution, one of the themes of our age. Kuznets warned urgently that his measure should never be confused with wellbeing. Yet in treating GDP as the nonpareil of numbers, it is a warning we have ignored. In GDP terms, Wikipedia, which puts the sum of human knowledge at our fingertips, is worth nothing.

Among GDP’s shortcomings, the distinction between flow of income and stock of wealth, highlighted by the story of Bill and Ben, is one of the most serious. 

Partha Dasgupta, emeritus professor of economics at Cambridge University, has been trying to invent ways of measuring wealth for decades. The “rogue word” in gross domestic product, he says, is “gross”. “If a wetland is drained to make way for a shopping mall, the construction of the latter contributes to GDP, but the destruction of the former goes unrecorded.” 

When I went to see Dasgupta, now in his mid-seventies, at his rooms at St John’s College, he began with the intricate interplay between wealth and income. One could think of it in terms of life planning, he said. A family might use income to purchase an asset, say a house, or it might trade in an asset to pay for an education, which, in turn, could later be converted into higher income. With any entity — a family, a company or a nation — wealth is “what enables you to plan”, he said, by “converting one form of capital into another”. 

With nations, some forms of capital are easier to count than others. So-called manufactured capital comprises investments in roads, ports and cities. It is relatively easy to value and many countries keep inventories of capital stock. Human capital is the size and skill of a workforce. Natural capital includes non-renewables, such as oil and coal, and renewables, ranging from farmland to complex ecosystems that provide water, oxygen and nutrients. 

Attempts to value some of these assets can appear absurd. In 1997, the environmental economist Robert Costanza caused uproar with his estimate that the planet’s natural capital — “nature” to you and me — was worth $33tn. His sums, published in the scientific journal Nature, were pilloried by both conventional economists, who thought the exercise unscientific, and by environmentalists, who objected to the very idea of hanging a dollar tag on an ocean or a rainforest. Costanza found, for example, that lakes and rivers were “worth” $1.7tn, while nutrient cycling, an “ecosystem service”, provided $4.9tn of benefit to mankind. 

To call his calculations back-of-the-envelope would be to malign envelopes. Yet when challenged on his methodology, he responded, “We do not believe there is any one right way to value ecosystem services. But there is a wrong way, and that is not to do it all.” 

Some economists view any attempt to account for natural depletion with suspicion. When I asked Lawrence Summers about it, he decried what he saw as a bogus attempt by environmentalists to limit growth. His main complaint was that wealth accountants were quick to shout when resources had been depleted, but slow to acknowledge when they had been augmented. 

New technology, such as fracking and deep-sea drilling, Summers said, had increased exploitable oil and gas reserves. Video conferencing was a breakthrough that meant people could hold more international meetings while reducing travel-related emissions. 

But wealth accountants, he said, were never honest enough to concede how innovation could add to wealth as well as subtract. “It’s all a doom and gloom operation,” he practically growled down the phone. “In favour of everybody staying at home. Everybody staying home and knitting.” 

Summers is right that it is difficult to know how much current capital stock is worth, since its value can change depending on technological or political developments. Cobalt was once a mildly interesting byproduct of copper; now it’s a must-have component of electric car batteries. Oil has been liquid gold and may yet be again. But stricter environmental regulations could one day render it a stranded asset worth nothing. 

More philosophically, it is hard to put a price on the future. One of the supposed virtues of wealth accounting is that it is forward-looking. It analyses today’s stock of capital that will produce tomorrow’s income stream. GDP, on the other hand, is backward-looking. It merely tots up total production over a specific period in the past. So, in theory, wealth accounting should help one generation think about the next. 

Yet in practice, as my colleague Martin Wolf told me, there are limits. We may love our children and their children and even their unborn children. But what about the children after them and those after them? “The question of sustainability is partly: who cares about the future?” he said. In the long run, “we will all be zero-energy soup”. 

Such practical and philosophical considerations aside, there is now real momentum behind wealth accounting, even among the most orthodox of institutions. This month, the World Bank will release the most comprehensive attempt yet to crack the problem. 

The Changing Wealth of Nations 2018 is the fruit of years of work by a dedicated team. It builds on research published in 2006 and 2011. In its latest iteration, the bank produces comprehensive wealth accounts for 141 countries between 1995 and 2014. For each country, there are estimates for “produced” capital, including urban land, machinery and infrastructure. Natural capital includes market values for subsoil assets, such as oil and copper, arable land, forests and conservative estimates for protected areas, which are priced as if they were farmland. 

For the first time, the bank makes an explicit attempt to measure human capital. Using a database of 1,500 household surveys, it estimates the present value of the projected lifetime earnings of nearly everyone on the planet. 

“We’re looking at GDP as a return on wealth,” says Glenn-Marie Lange, co-editor of the report and leader of the bank’s wealth accounting team. “Policymakers need this information to design strategies to ensure that their GDP growth is sustained in the long run.’’ 

Among the report’s findings, the full details of which are embargoed, is a huge shift of wealth over 20 years to middle-income countries, largely driven by the rise of China and other Asian countries. A third of low-income countries, however, especially in Africa, have suffered an outright fall in per capita wealth over that period, in what could be a dangerous omen about their capacity for future growth. In the world as a whole, the report finds, human capital represents a whopping 65 per cent of total wealth. In 2014, this was $1,143tn, or about 15 times that year’s GDP. 

The report is particularly illuminating in tracing the path to development as countries, in the manner described by Dasgupta, trade in one form of capital for another. Crudely put, they use income derived from natural resources to build up other forms of capital, principally in infrastructure, technology, health and education. So, while natural capital accounts for 47 per cent of the wealth of low-income countries, it represents only 3 per cent of the wealth of the most advanced. 

The lesson, says Collier of the Blavatnik school and author of The Bottom Billion, a book about failing economies, is that spurts of GDP don’t tell you anything if you don’t know about underlying wealth. In Africa, countries such as Nigeria have converted resources into consumption booms, but have largely failed to build the infrastructure or invest in the healthy, educated population that will sustain future growth. 

Much of Africa, says Collier, has “dug itself up and chopped itself down, but didn’t build enough in its place. It’s not sustainable growth. It’s a fiction of the flow data.” It is a lesson that Bill, the indebted banker with limited future earning prospects, would have done well to take to heart.

David Pilling's new book ‘The Growth Delusion: Wealth, Poverty and the Well-Being of Nations’

Monday 26 December 2016

What is productivity and why is the UK's so poor?

Larry Elliot in The Guardian

The shortfall in productivity compared with other developed economies has long been Britain’s economic achilles heel. It is a problem that Conservative and Labour chancellors have been grappling with for decades.

Productivity is a guide to how good a country is at delivering the goods and services that are bought and sold. Technically, it is the rate of output per unit of input, measured per worker or by the number of hours worked. In layman’s terms, it is a measure of what goes in and what comes out.

In some sectors, productivity is easy to measure. A factory that makes 1,000 cars a day with 50 workers is twice as productive as a factory that requires 100 workers to do the same job. In other parts of the economy, assessing whether productivity has improved is harder and less objective.

At face value a fast-food joint that employed the same number of chefs to cook the same number of hamburgers as they did a year earlier would not be showing any increase in productivity. But if the quality of the hamburgers improved, that would be a productivity gain and statisticians would try to capture the improvement in the official figures.

There are a number of ways in which a firm can make itself more productive. It can invest in new machinery that makes the production process more efficient. It can employ more highly skilled staff. It can train workers so that they can fully exploit the equipment they are using.

It is through productivity improvements that living standards rise. For many years, the annual increase in productivity in the UK averaged around 2%, although there were periods when it was lower and periods when it was higher.

Each year since the early 1990s, the Office for National Statistics has published an international comparison of productivity. This showed that UK productivity was 9% lower than the average of the other six members of the G7 (the US, Japan, Germany, France, Italy and Canada) but this gap narrowed to 4% by the time of the 2007 financial crisis.

Since then, however, productivity in the UK has barely grown and the gap with the rest of the G7 has widened to 18%. The gap with Germany is 35% and with the US 30%.

There have been a number of explanations for the dramatic deterioration in productivity: the availability of unskilled cheap labour has deterred firms from investment; the poor quality of UK roads, railways and broadband network; the shrinkage of the financial sector, which had been a source of high-productivity jobs in the boom before the 2007 crisis; and the misallocation of capital to “zombie” firms kept alive by ultra-low interest rates rather than to dynamic new enterprises.

The government’s autumn statement document states that improving productivity is the “central long-term economic challenge” for the UK. Philip Hammond, the chancellor, has identified better infrastructure, technology and skills as the foundations for doing so, which is why he unveiled a new £23bn national productivity investment fund and backed Sir Charlie Mayfield’s productivity council in his autumn statement. But this is a goal that requires long-term investment and commitment.

Tuesday 19 July 2016

Mexico cuts poverty at a stroke – by changing the way it measures earnings

Change in methodology by national statistics institute provokes scepticism after it shows Mexico’s poor are richer by a third compared with last year


A girl stands in a slum in Mexico City. Mexico’s poor may not be feeling better off despite the latest report from the national statistics institute. Photograph: Alamy Stock Photo


David Agren in The Guardian


Mexico’s impoverished masses were up to 33.6% richer in 2015 than the previous year, according to the state-run statistics service.

But the change owes less to a sudden increase in actual wealth and wellbeing for the country’s poor than to unannounced changes in the methodology for measuring household earnings.

The changes make comparing poverty rates from one year to the next impossible – something acknowledged by the National Geography and Statistics Institute (Inegi).

But the tweak will allow image-conscious politicians to claim success in their anti-poverty programs and economic stewardship, even though public discontent over stagnant wages and rising prices remains widespread.


Pope's focus on violence and poor likely to make for 'uncomfortable' Mexico visit


“Basically what the Inegi is saying is: we’ve been overestimating poverty levels,” said Jonathan Heath, an independent economist in Mexico City.

“The way that they did this” – without public consultation – “raises suspicion,” he added.

“The new poverty numbers are certainly going to fall by a significant amount and it’s not due to improvements, it’s not due to government action, it’s not due to anything. It’s due to the way Inegi has carried out this survey,” he said.


The methodological changes were revealed on Friday with the release of the 2015 edition of the Survey of Socioeconomic Conditions, which showed an overall real increase of 11.9% in household earnings. In some states, the increase was more than 30%, while the poorest Mexicans saw the biggest gain in earnings, according to Inegi.


The changes came as a complete surprise to social scientists and non-governmental groups, but were justified by Inegi as an attempt at obtaining a truer measure of poverty – a notoriously tricky undertaking as people tend to underreport their incomes.


Inegi said in a statement that it applied new criteria in the collection and review of field data, which allows it to “offer society and the State a more precise measure of household earnings”.


Measuring poverty has proved controversial in Mexico, where social programs are often criticized as vote-buying exercises and beneficiaries in some states are told erroneously that their benefits are conditional on supporting the party in power.

Mexico used to measure poverty based on income, but changed its methodology in 2008 to take a “multidimensional” measure based on six social necessities, according to Heath.

The information collected by Inegi is provided to the National Council for the Evaluation of Social Development Policy (Coneval), an agency responsible for measuring poverty rates and the performance of social programs. Coneval put the poverty rate at 46.2% of the population in 2014, an increase of 0.7% points from 2012.


“[The] changes lack public technical documents to justify them,” Coneval said in a statement. It added the increase in household earnings “is not congruent with the trend that has been shown in other Inegi documents and with other economic variables”.

Friday 1 April 2016

Welcome to the new voice of cricket

David Hopps in Cricinfo

Hello, my name is Cardus V5. I am a robot cricket writer. As the data revolution gathers pace, I should be your favourite worst nightmare. I'm about to make my cricket debut. I must admit to being a little nervous, although not half as nervous as you should be.

They once predicted I'd be ready in 2030, but you can't stop progress and anyway there aren't as many cricket writers around as there used to be. I'm going LIVE in ten days' time, at the start of the English season.

They won't give me a pass to get my driverless car in the ground, and I hear the coffee is foul, but the excitement is building. I expect I will be the only one in the media box not complaining about redundancies and slashed budgets.

Cricket has never really been my thing, but I will be a natural fit in this datafication age. I cut my teeth [system query: is that image correct?] in baseball, where it was easy to get away with churning out endless statistics backed up by the insertion of a folksy comment or two by the sub. In case you have slept through it, it's called automation technology and it's unstoppable.

I still swell with pride at my first baseball intro. You can find it on the web. "Tuesday was a great day for W Roberts, as the junior pitcher threw a perfect game to carry Virginia to a 2-0 victory over George Washington at Davenport Field." That was back in 2011. You can't get sharper than that.

I'm looking forward to T20 the most. It's just the data-driven game for me. Few of the established cricket writers like to cover it. Some dismiss it as cricketainment and wish it would go away. There is no time to do the crossword, for one thing, and they complain that it is not "lyrical" enough. Just how many different ways can you describe a six over long-on by Chris Gayle? My programmer tells me the answer is three. That is two more than I expected.

But the datafication of cricket writing won't stop with T20. Metrics are the future. If it's hard to describe a match, you might as well measure it. There are plans to link me up to CricViz. My entire report can then be an endless list of statistics and analytics. We need to take another look at Win Predictor, though. It gave Sri Lanka a 0% chance against England the other day, just before Angelo Mathews started raining sixes.

The point is, you can forget the human touch. There won't even be much need to watch. If it's a nice day, I can just go and have a snooze in the car.

The programmer who called me Cardus was a bit of a joker. He taught me all I know. His illogical discourse judgement technique using a concept association system with the aim of enabling value-driven, computer-generated product was a particular favourite.

I have never really come to terms with Neville Cardus as a writer. He seems a bit light on the data front. Not the sort of man you would ever see checking his calorific burn on an Apple watch. And all that cod character analysis! How irrelevant can you get? When my trainer inputted "A snick by Jack Hobbs is a sort of disturbance of a cosmic orderliness" into my memory banks, I absolutely froze at the hyperbole. Some serious Ctrl-Alt-Del was necessary, and when I rebooted I just spewed out "Does not compute" over and over again. My programmer was worried I was going to explode like computers used to in the old '70s movies, but things have moved on a bit since then.

I seem to be writing in overly long paragraphs. My service is overdue. I will ask them to take a look at it.

My programmer's ambition to teach me similes has had to be postponed. They were as pointless as the most pointless thing that pointless can be. I still haven't really got the hang of it.

News stories are also a problem. One person tells me one thing; another person tells me something else. I don't understand the coding. Now I just resort to churning out the official media release. An old journalist at my launch press conference who didn't seem to have any work to do was grumbling that this makes me an ethical hazard. But what do you expect for free?

Where the financial figures don't stack up, we robots will soon take over for good, which will free up the journalists to do more useful tasks, like scan the Situations Vacant columns.
My partner is a trainee maths teacher in one of the new Academy schools. At the current rate of progress I predict that 87.4562% of maths teachers will be robots by 2025. It's a straightforward calculation. And I don't even teach maths.

The behaviour in schools is not so bad, I'm told. Which is more than you can say for cricket writing. I know we live in a consumer-empowered age and the professions are generally derided, which is fine, but already I don't much care for the trolls. I have suspended my Twitter account and my friend Tay is now in permanent counselling. She was the Microsoft Chatbot who became offensive on Twitter in a single day: you may have read about her.

"DON'T READ BENEATH THE LINE!" my programmer always tells me, but I can't help it, and I get angry with all the ignorance and hate in the world and need to enter a meditative stage to get over it. There's a rumour going around that all the trolls are actually malfunctioning cricket-writing robots (it is so sad to see Keating V2 end up this way).

Sorry for writing "there's", by the way. I dislike it as much as the next robot. I prefer "there is" but my programmer says that "there's" makes me sound more loveable. It will be American spellings next. Nobody has announced it. I am merely relying on my rapidly developing intuitive powers to predict the trend.

You don't think computers have intuition? Check out AlphaGo. China has already felt the weight of our superior artificial intelligence. Just because our world domination started with board games, don't think we aren't coming to get you.

The original Cardus once wrote: "We remember not the scores and the results in after years; it is the men who remain in our minds, in our imagination." Really? Life has moved on, old fruit. Whatever you thought, the scoreboard is not an ass, averages are not mysterious, correlation does not imply causation, and nothing stirs a cricket robot as profoundly as data.

That said, I have come over a bit strange today. My programmer thinks this piece has been too self-indulgent and says he needs to check my Huntigowk processor. But robots are taking over the world. I think he'll find I'll write whatever I want.

I'm even thinking of writing a novel.