by George Monbiot
What would you do with £245? Would you (a) use it to buy food for the
next five weeks?, (b) put it towards a family holiday?, (c) use it to
double your annual savings?, or (d) give it to the Duke of Westminster?
Let me make the case for option (d). This year he was plunged into
relative poverty. Relative, that is, to the three parvenus who have
displaced him from the top of the UK rich list(1). (Admittedly he’s not
so badly off in absolute terms: the value of his properties rose last
year, to £7bn). He’s the highest ranked of the British-born people on
the list, and we surely have a patriotic duty to keep him there. And
he’s a splendid example of British enterprise, being enterprising enough
to have inherited his land and income from his father.
Well there must be a reason, mustn’t there? Why else would households be
paying this money – equivalent to five weeks’ average spending on food
and almost their average annual savings (£296)(2) – to some of the
richest men and women in the UK? Why else would this 21st Century tithe,
this back-to-front Robin Hood tax, be levied?
I’m talking about the payments we make to Big Farmer through the Common
Agricultural Policy. They swallow €55bn (£47bn) a year, or 43% of the
European budget(3). Despite the spending crisis raging through Europe,
the policy remains intact. Worse, governments intend to sustain this
level of spending throughout the next budget period, from 2014-2020(4).
Of all perverse public spending in the rich nations, farm subsidies must
be among the most regressive. In the European Union you are paid
according to the size of your lands: the greater the area, the more you
get. Except in Spain, nowhere is the subsidy system more injust than in
the United Kingdom. According to Kevin Cahill, author of Who Owns
Britain, 69% of the land here is owned by 0.6% of the population(5). It
is this group which takes the major pay-outs. The entire budget,
according to the government’s database, is shared between just 16,000
people or businesses(6)*. Let me give you some examples, beginning with a
few old friends.
As chairman of Northern Rock, Matt Ridley oversaw the first run on a
British bank since 1878, and helped precipitate the economic crisis
which has impoverished so many. This champion of free market economics
and his family received £205,000 from the taxpayer last year for owning
their appropriately-named Blagdon Estate(7). That falls a little shy of
the public beneficence extended to Prince Bandar, the Saudi Arabian
fixer at the centre of the Al-Yamamah corruption scandal. In 2007 the
Guardian discovered that he had received a payment of up to £1bn from
the weapons manufacturer BAE(8). He used his hard-earned wealth to buy
the Glympton Estate in Oxfordshire(9). For this public service we pay
him £270,000 a year(10). Much obliged to you guv’nor, I’m sure.
But it’s the true captains of British enterprise – the aristocrats and
the utility companies, equally deserving of their good fortune – who
really clean up. The Duke of Devonshire gets £390,000(11), the Duke of
Buucleuch £405,000(12), the Earl of Plymouth £560,000(13), the Earl of
Moray £770,000(14), the Duke of Westminster £820,000(15). The Vestey
family takes £1.2m(16). You’ll be pleased to hear that the previous
owner of their Thurlow estate, Edmund Vestey, who died in 2008, managed
his tax affairs so efficiently that in one year his businesses paid
just £10. Asked to comment on his contribution to the public good, he
explained, “we’re all tax dodgers, aren’t we?”(17).
British households, who try so hard to keep the water companies in the
style to which they’re accustomed, have been blessed with another means
of supporting this deserving cause. Yorkshire water takes £290,000 in
farm subsidies, Welsh Water £330,000, Severn Trent, £650,000, United
Utilities, £1.3m. Serco, one of the largest recipients of another form
of corporate welfare – the private finance initiative – gets a further
£2m for owning farmland(18).
Among the top blaggers are some voluntary bodies. The RSPB gets £4.8m,
the National Trust £8m, the various wildlife trusts a total of
£8.5m(19). I don’t have a problem with these bodies receiving public
money. I do have a problem with their receipt of public money through a
channel as undemocratic and unaccountable as this. I have an even bigger
problem with their use of money with these strings attached. For the
past year, while researching my book about rewilding, I’ve been
puzzling over why these bodies fetishise degraded farmland ecosystems
and are so reluctant to allow their estates to revert to nature. Now it
seems obvious. To receive these subsidies, you must farm the land(20).
As for the biggest beneficiary, it is shrouded in mystery. It’s a
company based in France called Syral UK Ltd. Its website describes it as
a producer of industrial starch, alcohol and proteins, but says nothing
about owning or farming any land(21). Yet it receives £18.7m from the
taxpayer. It has not yet answered my questions about how this has
happened, but my guess is that the money might take the form of export
subsidies: the kind of payments which have done so much to damage the
livelihoods of poor farmers in the developing world.
In one respect the government of this country has got it right. It has
lobbied the European Commission, so far unsuccessfully, for “a very
substantial cut to the CAP budget”(22). But hold the enthusiasm. It has
also demanded that the EC drop the only sensible proposal in the draft
now being negotiated by member states: that there should be a limit to
the amount that a landowner can receive(23). Our government warns that
capping the payments “would impede consolidation” of landholdings(24).
It seems that 0.6% of the population owning 69% of the land isn’t
inequitable enough.
If subsidies have any remaining purpose it is surely to protect the
smallest, most vulnerable farmers. The UK government’s proposals would
ensure that the budget continues to be hogged by the biggest landlords.
As for payments for protecting the environment, this looks to me like
the option you’re left with when you refuse to regulate. The rest of us
don’t get paid for not mugging old ladies. Why should farmers be paid
for not trashing the biosphere? Why should they not be legally bound to
protect it, as other businesses are?
In the midst of economic crisis, European governments intend to keep the
ultra-rich in vintage port and racehorses at least until 2020. While
inflicting the harshest of free market economics upon everyone else,
they will oblige us to support a parasitic class of tax avoiders and
hedgerow-grubbers, who engorge themselves on the benefactions of the
poor.
www.monbiot.com
*UPDATE: It’s just dawned on me that the government’s list must be
incomplete. It says it covers all “legal persons”, but it seems that
legal persons excludes actual persons, as opposed to companies,
partnerships, trusts etc. It would be fascinating to discover whose
subsidies have not being listed.
References:
1. http://www.therichest.org/nation/sunday-times-rich-list-2011/
2. The average UK household contribution to the CAP is £245 (DEFRA, by
email). Average household weekly expenditure on food and drink is
£52.20. Average household weekly savings and investments is £5.70.
Office of National Statistics, 2010. Family Spending 2010 Edition. Table
A1: Components of Household Expenditure 2009.
http://www.ons.gov.uk/ons/publications/re-reference-tables.html?edition=tcm%3A77-225698
3. DEFRA, by email.
4. European Commission, 19th October 2011. Regulation Establishing Rules
for Direct Payments to Farmers Under Support Schemes Within the
Framework of the Common Agricultural Policy. COM(2011) 625 final/2
2011/0280 (COD).
http://ec.europa.eu/agriculture/cap-post-2013/legal-proposals/com625/625_en.pdf
5. I wanted to go to source on this, but the copies available online are
amazingly expensive (there’s an irony here, but I can’t quite put my
finger on it). So I’ve relied on a report of the contents of his book:
http://www.newstatesman.com/society/2010/10/land-tax-labour-britain
6. The database is here:
http://www.cap-payments.defra.gov.uk/Download.aspx DEFRA’s database
search facility isn’t working –
http://www.cap-payments.defra.gov.uk/Search.aspx – so you’ll have to go
through the spreadsheets yourself.
7. The entry in the database is for Blagdon Farming Ltd. I checked
online: this is one of the properties of the Blagdon Estate.
http://www.blagdonestate.co.uk/theblagdonhomefarm.htm ,
http://www.192.com/atoz/business/newcastle-upon-tyne-ne13/farming-mixed/blagdon-farming-ltd/292e5a6d3883fe2f4a207c94d6c41e61747a8b50/ml/
and
http://www.misterwhat.co.uk/company/384132-blagdon-farming-ltd-newcastle-upon-tyne
8. http://www.guardian.co.uk/world/2007/jun/07/bae1
http://www.guardian.co.uk/world/2007/jun/09/bae.foreignpolicy
9. http://www.guardian.co.uk/baefiles/page/0,,2095831,00.html
10. The payment is listed as Glympton Farms Ltd. I rang them – they confirmed that Glympton Farms belongs to the estate.
11. Listed as Chatsworth Settlement Trustees. This page identifies the owners: http://www.boltonabbey.com/welcome_trustees.htm
12. Listed as Buccleuch Estates Ltd
13. Listed as Earl of Plymouth Estates Ltd.
14. Listed as Moray Estates Development Co.
15. Listed as Grosvenor Farms Limited. See http://www.grosvenorestate.com/Business/Grosvenor+Farms.htm
16. Listed as Thurlow Estate Farms Ltd. See
http://www.telegraph.co.uk/news/obituaries/1570710/Edmund-Vestey.html
and
http://www.independent.co.uk/news/uk/home-news/fat-cats-benefit-from-eu-farming-subsidies-780192.html
17. http://www.guardian.co.uk/business/2008/dec/07/edmund-vestey-tax-will
18. All these utility companies are listed under their own names.
19. I stopped adding the wildlife trust payments shortly after getting
down to the £100,000 level, so it is probably a little more than this.
20. The CAP’s Good Agricultural and Environmental Condition rules (an
Orwellian term if ever there was one) forbid what they disparagingly
call “land abandonment”.
21. http://www.tereos-syral.com/web/syral_web.nsf/Home/index.htm
22. DEFRA, January 2011. UK response to the Commission communication and consultation:
“The CAP towards 2020: Meeting the food, natural resources and
territorial challenges of the future”.
http://archive.defra.gov.uk/foodfarm/policy/capreform/documents/110128-uk-cap-response.pdf
23. European Commission, 19th October 2011, as above.
24. DEFRA, January 2011, as above.
Monday, 5 December 2011
Climate Justice Requires A New Paradigm
By Vandana Shiva
02 December, 2011
Newleftproject.org
Newleftproject.org
Twenty Years ago, at the
Earth Summit, the world’s Governments signed the UN Framework
Convention on Climate Change to create a legally binding framework to
address the challenge of climate change.
Today, the Green House Gas emissions that contribute to climate change have increased not reduced.
The Climate Treaty is weaker not stronger.
The failure to reduce green house gases is linked to
following the flawed route of carbon trading and emissions trading as
the main objective of the Kyoto Protocol to the Climate Convention.
The Kyoto Protocol allows industrialized countries
to trade their allocation of carbon emissions among themselves (Article
17). It also allows an “investor” in an industrialized country (industry
or government) to invest in an eligible carbon mitigation project in a
developing country in exchange for Certified Emission Reduction Units
that can be used to meet obligation to reduce greenhouse gas emissions.
This is referred to as the Clean Development Mechanism (CDM) under
Article 12 of the Kyoto Protocol. The Kyoto Protocol gave 38
industrialized countries that are the worst historical polluter’s
emissions rights. The European Union Emissions Trading Scheme (ETS)
rewarded 11,428 industrial installations with carbon dioxide emissions
rights. Through emissions trading Larry Lohmann observes, “rights to the
earth’s carbon cycling capacity are gravitating into the hands of those
who have the most power to appropriate them and the most financial
interest to do so”. That such schemes are more about privatizing the
atmosphere than preventing climate change is made clear by the fact that
the rights given away in the Kyoto Protocol were several times higher
than the levels needed to prevent a 2°C rise in global temperatures.
Climate activists focused exclusively on getting the
Kyoto Protocol implemented in the first phase. They thus, innocently,
played along with the polluters.
By the time the Copenhagen Summit took place, the
polluters were even better organised and subverted a legally building
outcome by having President Obama push the Copenhagen Accord.
Copenhagen and Beyond : The agenda for Earth Democracy
The UN Climate Summit in Copenhagen was probably the
largest gathering of citizens and governments [ever? To do with what?].
The numbers were huge because the issue is urgent. Climate chaos is
already costing millions of lives and billions of dollars. The world had
gathered to get legally binding cuts in emissions by the rich North in
the post Kyoto phase i.e. after 2010. Science tells us that to keep
temperature rise within 2°C, an 80% cut is needed by 2020. Without a
legally binding treaty, emissions of greenhouse gases will not be cut,
the polluters will continue to pollute, and life on earth will be
increasingly threatened.
There were multiple contests at Copenhagen, reflecting multiple dimensions of climate wars. These contests included those:
>> Between the earth’s ecological limits and limitless growth (with its associated limitless pollution and limitless resource exploitation).>> Between the need for legally binding commitments and the U.S led initiative to dismantle the international framework of legally binding obligations to reduce greenhouse gas emissions.>> Between the economically powerful historical polluters of the North and economically weak southern countries who are the victims of climate change, with the BASIC countries (Brazil, South Africa, India, China) negotiating with the South but finally signing the Copenhagen Accord with the U.S.>> Between corporate rule based on greed and profits and military power, and Earth Democracy based on sustainability, justice and peace.
The hundreds of thousands of people who gathered at
Klimaforum and on the streets of Copenhagen came as earth citizens.
Danes and Africans, Americans and Latin Americans, Canadians and Indian
were one in their care for the earth, for climate justice, for the
rights of the poor and the vulnerable, and for the rights of future
generations.
Never before has there been such a large presence of
citizens at a UN Conference. Never before have climate negotiations
seen such a large people’s participation. People came to Copenhagen
because they are fully aware of the seriousness of the climate crisis,
and deeply committed to taking action to change production and
consumption patterns.
Ever since the Earth Summit in 1992 in Rio de
Janeiro the U.S has been unwilling to be part of the UN framework of
international law. It never signed the Kyoto Protocol. During his trip
to China, President Obama with Prime Minster Rasmussen of Denmark had
already announced that there would only be a political declaration in
Copenhagen, not a legally binding outcome.
And this is exactly what the world got – a
non-binding Copenhagen Accord, initially signed by five countries, the
US and the Basic Four, and then supported by 26 others – with the rest
of the 192 UN member states left out of the process. Most countries came
to know that an “accord” had been reached when President Obama
announced the accord to the U.S Press Corp. Most excluded countries
refused to sign the accord. It remained an agreement between those
countries that chose to declare their adherence. But it nevertheless
showed the willingness of the US and others to disregard the needs of
those in the global South. Arguing against the accord, Sudan’s
Ambassador Lumumba Di Aping said the 2°C increase accepted in the
document would result in a 3 to 5 degree rise in temperature in Africa.
He saw the pact as a suicide pact to maintain the economic dominance of a
few countries.
As Jeffrey Sachs noted in his article “Obama undermines UN Climate Process”:
“Obama’s decision to declare a phoney negotiating victory undermines the UN process by signaling that rich countries will do what they want and must no longer listen to the “pesky” concerns of many smaller and poorer countries – International Law, as complicated as it is, has been replaced by the insincere, inconsistent, and unconvincing word of a few powers, notably the U.S. America has insisted that others sign on to its terms – leaving the UN process hanging by a thread.”[1]
Even though the intention of the award was to
dismantle the UN process, the reports of the two ad-hoc working groups
on the Kyoto Protocol (AWG-KP) and the long term cooperative action
(AWG-LCA) which have been negotiating for four years and two years were
adopted in the closing plenary.
The Copenhagen Accord will undoubtedly interfere
with the official UNFCC process in future negotiations as it did in
Copenhagen. Like the earth’s future, the future of the UN now hangs in
balance. There has been repeated reference to the emergence of a new
world order in Copenhagen. But this is the world order shaped by
corporate globalization and the WTO, not by the UN Climate Treaty. It is
a world order based on the outsourcing of pollution from the rich
industrialized North to countries like China and India. It is a world
order based on the rights of polluters.
Climate change today is global in cause and global
in effect. Globalisation of the economy has outsourced energy-intensive
production to countries like China, which is flooding the shelves of
supermarkets with cheap products. The corporations of the North and the
consumers of the North thus bear responsibility for the increased
emissions in the countries of the South.
In fact, the rural poor in China and India are
losing their land and livelihood to make way for an energy-intensive
industrialization. To count them as polluters would be doubly criminal;
corporations, not nations, are the appropriate basis for regulations
atmospheric pollution in a globalised economy.
Twelve years after citizens movements and African
governments shut down the WTO Ministerial in Seattle, the same contest
between corporate power and citizens power, between limitless profits
and growth and the limits of a fragile earth was played out in
Copenhagen. The only difference was that in trade negotiations the
commercial interests of corporation’s stands naked, whereas in climate
negotiations corporate power hides behind corporate states. The
Copenhagen Accord is in reality the accord of global corporations to
continue to pollute globally by attempting to dismantling the UN Climate
Treaty. It should be called the “Right to Pollute Accord”. It has no
legally binding emission targets.
The COP 15 talks in Copenhagen and COP 16 in Cancun
did not show much promise of an outcome that would reduce Green House
Gas Emissions and avoid catastrophic climate change. And the deadlock is
caused by an outmoded growth paradigm. There are series of false
assumptions driving the negotiations, or rather, blocking them.
>> False assumption No. 1: GNP measures Quality of Life>> False assumption No. 2: Growth in GNP and improvement in Quality of Life is based on increased use of Fossil Fuel>> False assumption No. 3: Growth and Fossil Fuel use have no limits>> False assumption No. 4: Polluters have no responsibility, only rights.
These false assumptions are stated ad nauseum by
corporations, governments and the media. As stated in an article in the
Times of India, “Emissions are directly related to the quality of life
and industrial production, and hence economic growth also has a direct
link with it”.
Assumption No. 1 is false because even as India’s
GNP has risen, the number of hungry people in India have grown. In fact,
India is now the capital of hunger. The growth in GNP has in fact
undermined the quality of life of the poor in India. And it has
concentrated wealth in the hands of a few 100 billionaires now control
25% of India’s economy.
Assumption No. 2 is false because there are
alternatives to fossil fuels such as renewable energy. Further,
reduction in fossil fuel use can actually improve the quality of food
and quality of life. Industrial agriculture based on fossil fuels uses
ten units of energy to produce one unit of food. Ecological systems
based on internal inputs produce 2 to 3 units out of every unit of
energy used. We can therefore produce more and better quality of food by
reducing fossil fuel use.
Assumption No. 3 is false because the financial
collapse of 2008 showed that growth is not limitless, and Peak Oil shows
that fossil fuels will increasingly become more difficult to access and
will become costlier.
Assumption No. 4 formed the basis of carbon trading
and emissions trading under the Kyoto Protocol. This allowed polluters
to get paid billions of dollars instead of making the polluter pay. Thus
ArcelorMittal has walked away with £1 billion in the form of carbon
credits. ArcelorMittal was given the right to emit 90m tonnes of CO2
each year from its plants in EU from 2008 to 2012, while the company
only emitted 68m tonnes in 2008.
To protect the planet, to prevent climate
catastrophe through continued pollution, we will have to continue to
work beyond Copenhagen by building Earth Democracy based on principles
of justice and sustainability. The struggle for climate justice and
trade justice are one struggle, not two. The climate crisis is a result
of an economic model based on fossil fuel energy and resource intensive
production and consumption systems. The Copenhagen Accord was designed
to extend the life of this obsolete model for living on earth. Earth
Democracy can help us build another future for the human species – a
future in which we recognize we are members of the earth family that
protecting the earth and her living processes is part of our species
identity and meaning. The polluters of the world united in Copenhagen to
prevent a legally binding accord to cut emissions and prevent
disastrous climate change. They extended the climate war. Now citizens
of the earth must unite to pressurize governments and corporations to
obey the laws of the Earth, the laws of Gaia and make climate peace. And
for this we will have to be the change we want to see.
As I have written in Soil Not Oil,
food is where we can begin. 40% emissions are produced by fossil fuel
based chemical, globalised food and agriculture systems which are also
pushing our farmers to suicide and destroying our health. 40% reduction
in emissions can take place through biodiverse organic farming, which
sequesters carbon while enriching our soils and our diets. The polluters
ganged up in Copenhagen for a non-solution. We as Earth Citizens can
organize where we are for real solutions.
References
[1] Economic Times, 25th December, 2009
Vandana Shiva is a philosopher,
environmental activist, and eco feminist. Shiva, currently based in
Delhi, has authored more than 20 books and over 500 papers in leading
scientific and technical journals. She was trained as a physicist and
received her Ph.D. in physics from the University of Western Ontario,
Canada. She was awarded the Right Livelihood Award in 1993. She is the
founder of Navdanya
Cricket - Bowling Analysis of Great Performances
December 5, 2011Posted by Anantha Narayanan 1 hour, 10 minutes ago in Tests - bowling
Five-wicket hauls in Tests: a look across and deep - part one
 Michael Holding: 14 wickets on a flat track at The Oval in 1976
© Getty Images
Michael Holding: 14 wickets on a flat track at The Oval in 1976
© Getty ImagesFirst, the term used. Let me reproduce the Wikipedia entry below.
Five-wicket haul (also Five-for, five-fer, fifer, or shortened to 5WI or FWI)
Five or more wickets taken by a bowler in an innings, considered a very good performance. The term fifer is an abbreviation of the usual form of writing bowling statistics, e.g. a bowler who takes 5 wickets and concedes 117 runs is said to have figures of "5 for 117" or "5-117". Sometimes called a "Michelle", after actress Michelle Pfeiffer. I like the term "Fifer". However since that also refers to the foot-soldier who plays the "Fife", the Scottish flute, I am somewhat reluctant. "Pfeiffer" would be injudicious. I am not too comfortable with "Five-for", being slightly contrived and seemingly incomplete. So I will stick with "fifer", a single non-hyphenated (!!!) word and my favourite. Much better than "DLF maximum" or "Karbonn Kamaal Katch".
Some maxims have to be repeated in EVERY article since quite a few readers have a one-track mind and see what only they want to see. This is not a Bowling Ratings article. The ordering is based on an indicated measure and is visible to the reader clearly. Do not draw any unintended inferences and come out with comments based on those. There is no personal discretion involved other than setting up the parameters. In view of the size of the articles and number of tables, I have kept my narratives to a minimum.
Test Bowling is a fascinating subject. It is far more nuanced that Batting when it comes to analysis.
- The number of wickets in an innings is strictly limited to 10.
- Bowling successes are very clearly defined and measurable in terms of wickets (who and when) and accuracy.
- Bowling is three-dimensional: balls, runs and wickets. These three dimension-related values are available for all bowling spells. (Batting is also three-dimensional: runs, time, balls. Unfortunately only runs information is available for all matches.)
- Batsmen win and save matches. Bowlers, almost always, win matches. They rarely draw matches, a la Atherton, Hanif et al. But you will be surprised: wait for the next article !!! A great ODI team can be founded on top-class batting and average bowling, not a great Test team.
- 5 batsmen can score hundreds in an innings, and have done so. Only two bowlers can capture 5 wickets each in an innings.
All these nuances lead to a more exciting analysis of fifers.
It took me nearly a week to think of all possibilities, write the program, prepare the tables and then weave the article around the tables. I did so much work on the keyboard that my legs (yes, you read it correctly) started aching. This turned out to be the longest article I had ever done, barring none. So I decided to release this in two parts. This will also enable me to do some specialized requests and add those tables. At the end of the article, I have indicated the types of analysis which have been included in Part 2. Even now, the current article has been exceeded in size by only one article, the one published last, on Special hundreds.
A note on the tables. I have standardized the presentation to have the first 14 columns common. These are self-explanatory. I have shown Home/Away (H/A), Bowling Type (S for spinners), innings bowled in and Result (W for Win, = for draw and * for loss).
First the basic table. I did not do this for the hundreds. However it is necessary to start with this table in the bowling analysis since many readers may not be familiar with all these performances.
1. 9+ wicket bowling performances in Tests
MtId Year For Vs  Score HA Bowler          BT I <--Analysis--> R

0428 1956 Eng Aus-205/10 H Laker J.C        S 3 51.2-23- 53-10 W
1443 1999 Ind Pak-207/10 H Kumble A         S 4 26.3- 9- 74-10 W
0048 1896 Eng Saf-151/10 A Lohmann G.A        2 12.0- 6- 28- 9 W
0428 1956 Eng Aus- 84/10 H Laker J.C        S 2 16.4- 4- 37- 9 W
1583 2002 Slk Zim-236/10 H Muralitharan M   S 1 40.0-19- 51- 9 W
1029 1985 Nzl Aus-179/10 A Hadlee R.J         1 23.4- 4- 52- 9 W
1081 1987 Pak Eng-175/10 H Abdul Qadir      S 1 37.0-13- 56- 9 W
1266 1994 Eng Saf-175/10 H Malcolm D.E        3 16.3- 2- 57- 9 W
1423 1998 Slk Eng-181/10 A Muralitharan M   S 3 54.2-27- 65- 9 W
0483 1959 Ind Aus-219/10 H Patel J.M        S 2 35.5-16- 69- 9 W
0967 1983 Ind Win-201/10 H Kapil Dev N        3 30.3- 6- 83- 9 *
0849 1979 Pak Aus-310/10 A Sarfraz Nawaz      4 47.2- 7- 86- 9 W
0683 1971 Win Ind-352/10 H Noreiga J.M      S 2 49.4-16- 95- 9 *
0461 1958 Ind Win-222/10 H Gupte S.P        S 1 34.3-11-102- 9 *
0131 1913 Eng Saf-231/10 A Barnes S.F         3 38.4- 7-103- 9 W
0437 1957 Saf Eng-214/10 H Tayfield H.J     S 4 49.2-11-113- 9 W
0138 1921 Aus Eng-315/10 H Mailey A.A       S 3 47.0- 8-121- 9 W
I have limited this to bowling spells in which the bowler captured 9 or more wickets. Only twice have bowlers captured all 10 wickets. Jim Laker's feat came 79 years and 427 Tests after Alfred Shaw bowled the first ball to Charles Bannerman. Anil Kumble's feat came a further 1015 Tests and 43 years after Laker dismissed Len Maddocks. I wonder how many years would pass before this happens again: let me say, around 2050. Laker had another 9-wicket haul, in the same match. Muttiah Muralitharan is the only other bowler to capture 9-wkts in an innings twice. Quite surprisingly, the three spinners, Muralitharan, Abdul Qadir and Subhash Gupte, captured 9 wickets on the first day. Another wonderful spinner, Hugh Tayfield's 9 for 113 was adjudged to be the best ever bowling performance in the Wisden-100 analysis. More of this performance later. Kapil Dev, Gupte and Jack Noreiga all captured 9-wickets in an innings, in vain. Surely let us all agree that no one, I repeat no one, in the next 1000 years, if Test cricket survives that far, would capture all 20 wickets in a match.
Now for something I think is very important, performance away from home.
2. Wonderful performances, away from home
MtId Year For Vs  Score HA Bowler          BT I <--Analysis--> R

0048 1896 Eng Saf-151/10 A Lohmann G.A        2 12.0- 6- 28- 9 W
1029 1985 Nzl Aus-179/10 A Hadlee R.J         1 23.4- 4- 52- 9 W
1423 1998 Slk Eng-181/10 A Muralitharan M   S 3 54.2-27- 65- 9 W
0849 1979 Pak Aus-310/10 A Sarfraz Nawaz      4 47.2- 7- 86- 9 W
0131 1913 Eng Saf-231/10 A Barnes S.F         3 38.4- 7-103- 9 W
0047 1896 Eng Saf- 30/10 A Lohmann G.A        4  8.1- 5-  7- 8 W
0032 1889 Eng Saf- 43/10 A Briggs J         S 3  9.4- 5- 11- 8 W
0104 1909 Aus Eng-119/10 A Laver F            2 18.2- 7- 31- 8 =
0026 1887 Eng Aus- 84/10 A Lohmann G.A        2 16.4-12- 35- 8 W
1370 1997 Aus Eng- 77/10 A McGrath G.D        1 20.3- 8- 38- 8 =
1398 1998 Eng Win-191/10 A Fraser A.R.C       2 16.1- 2- 53- 8 *
0699 1972 Aus Eng-116/10 A Massie R.A.L       3 27.2- 9- 53- 8 W
0131 1913 Eng Saf-160/10 A Barnes S.F         1 26.5- 9- 56- 8 W
0036 1892 Eng Aus-145/10 A Lohmann G.A        1 43.2-18- 58- 8 *
1341 1996 Saf Ind-137/10 A Klusener L         4 21.3- 4- 64- 8 W
0074 1902 Aus Eng-183/10 A Trumble H        S 2 31.0-13- 65- 8 *
0079 1904 Eng Aus-111/10 A Rhodes W         S 4 15.0- 0- 68- 8 W
0863 1979 Pak Ind-126/10 A Sikander Bakht     2 21.0- 3- 69- 8 =
1804 2006 Slk Eng-190/10 A Muralitharan M   S 4 30.0-11- 70- 8 W
1307 1995 Saf Zim-283/10 A Donald A.A         3 33.0-12- 71- 8 W
1258 1994 Eng Win-304/10 A Fraser A.R.C       2 28.5- 7- 75- 8 W
0769 1976 Ind Nzl-215/10 A Prasanna E.A.S   S 3 30.4- 5- 76- 8 W
0082 1904 Eng Aus-247/10 A Braund L.C       S 1 29.1- 6- 81- 8 *
1027 1985 Slk Pak-259/10 A Ratnayeke J.R      2 23.2- 5- 83- 8 *
0699 1972 Aus Eng-272/10 A Massie R.A.L       1 32.5- 7- 84- 8 W
0947 1983 Ind Pak-323/10 A Kapil Dev N        1 30.5- 7- 85- 8 =
0738 1974 Eng Win-305/10 A Greig A.W          2 36.1-10- 86- 8 W
0781 1976 Win Eng-435/10 A Holding M.A        2 33.0- 9- 92- 8 W
0057 1898 Eng Aus-239/10 A Richardson T       2 36.1- 7- 94- 8 *
0323 1950 Win Eng-312/10 A Valentine A.L    S 1 50.0-14-104- 8 *
1032 1985 Ind Aus-381/10 A Kapil Dev N        1 38.0- 6-106- 8 =
1797 2006 Aus Bng-427/10 A MacGill S.C.G    S 1 33.3- 2-108- 8 W
0179 1929 Eng Aus-336/10 A White J.C        S 4 64.5-21-126- 8 W
1020 1985 Aus Eng-482/ 9 A McDermott C.J      2 36.0- 3-141- 8 =
1680 2004 Ind Aus-474/10 A Kumble A         S 2 46.5- 7-141- 8 =
1892 2008 Aus Ind-441/10 A Krejza J.J         1 43.5- 1-215- 8 *
In view of the importance of this classification, I have lowered the cut-off to 8 wicket captures at the risk of going beyond my self-imposed limit of 25 table entries. The table is ordered by the bowling performance. George Lohmann, on those uncovered pitches of yonder, crossed 8 wickets mark no fewer than four times. Quite a few achieved this twice. Barnes, Fraser, Kapil Dev, Massie (in the same match) and Muralitharan. The 9-wicket captures of Hadlee, Muralitharan and Sarfraz Nawaz are probably the pick of the lot, all resulting in winning matches. Sarfraz, to boot, in the last innings. The last time this was done, was by an off-spinner on a baptism debut of fire in India.
Now for some special selections. The bowlers who captured the top-six batsmen.
3. Bowling spells in which top six wickets are captured - 1
MtId Year For Vs  Score HA Bowler          BT I <--Analysis--> R BA-T Avge

0235 1934 Aus Eng-627/ 9 A O'Reilly W.J     S 1 59.0- 9-189- 7 = 297  49.5
0461 1958 Ind Win-222/10 H Gupte S.P        S 1 34.3-11-102- 9 * 262  43.7
1804 2006 Slk Eng-190/10 A Muralitharan M   S 4 30.0-11- 70- 8 W 258  43.1
0990 1984 Eng Win-245/10 H Botham I.T         2 27.4- 6-103- 8 * 256  42.6
0754 1975 Eng Aus-304/10 A Underwood D.L    S 1 38.4- 3-113- 7 * 254  42.3
1110 1988 Aus Win-349/ 9 H Hughes M.G         3 37.0- 9- 87- 8 * 254  42.3
1443 1999 Ind Pak-207/10 H Kumble A         S 4 26.3- 9- 74-10 W 250  41.7
0913 1981 Aus Pak-500/ 8 H Yardley B        S 1 66.0-16-187- 7 * 248  41.3
1726 2004 Aus Pak- 72/10 H McGrath G.D        4 16.0- 8- 24- 8 W 244  40.7
1028 1985 Slk Pak-295/10 A de Mel A.L.F       2 22.0- 1-109- 6 * 240  40.0
0765 1975 Win Aus-169/10 A Roberts A.M.E      3 18.4- 3- 54- 7 W 235  39.2
1029 1985 Nzl Aus-179/10 A Hadlee R.J         1 23.4- 4- 52- 9 W 234  39.0
1513 2000 Pak Eng-480/ 8 H Saqlain Mushtaq  S 1 74.0-20-164- 8 = 234  39.0
1377 1997 Aus Eng-180/10 A McGrath G.D        1 21.0- 4- 76- 7 * 221  36.8
0428 1956 Eng Aus-205/10 H Laker J.C        S 3 51.2-23- 53-10 W 213  35.4
0975 1984 Nzl Eng-463/10 H Cairns B.L         2 45.0-10-143- 7 = 212  35.4
0788 1976 Eng Ind-122/10 A Lever J.K          2 23.0- 6- 46- 7 W 207  34.5
0083 1905 Eng Aus-188/10 H Bosanquet B.J.T  S 4 32.4- 2-107- 8 W 197  32.8
1525 2000 Aus Win-109/10 H Gillespie J.N      4 17.0- 5- 40- 6 W 189  31.4
0323 1950 Win Eng-312/10 A Valentine A.L    S 1 50.0-14-104- 8 * 185  30.8
1583 2002 Slk Zim-236/10 H Muralitharan M   S 1 40.0-19- 51- 9 W 180  30.0
1878 2008 Eng Nzl-123/10 H Anderson J.M       2 21.3- 8- 43- 7 W 165  27.6
0131 1913 Eng Saf-160/10 A Barnes S.F         1 26.5- 9- 56- 8 W 157  26.2
0424 1956 Win Nzl-157/ 9 A Atkinson D.S.t.E S 3 40.0-21- 53- 7 * 145  24.1
0039 1893 Eng Aus-269/10 H Lockwood W.H       2 37.3-11-101- 6 = 133  22.2
This table is ordered by the average of the batting averages of the six batsmen dismissed. O'Reilly dismissed Walters, Sutcliffe, Wyatt, Hammond, Hendren and Leyland, two of these on either side of 60.0. An imposing collection indeed. Gupte accounted for Holt, Hunte, Sobers, Kanhai, OG Smith and Butcher. Muralitharan dismissed Trescothick, Strauss, Cook, Pietersen, Collingwood and Flintoff. One cannot keep these two greats out. Muralitharan and McGrath are the only bowlers to do this twice in their career. Now for another view of the same group.
4. Bowling spells in which top six wickets are captured - 2
MtId Year For Vs  Score HA Bowler          BT I <--Analysis--> R Runs

1525 2000 Aus Win-109/10 H Gillespie J.N      4 17.0- 5- 40- 6 W  14
1726 2004 Aus Pak- 72/10 H McGrath G.D        4 16.0- 8- 24- 8 W  55
0131 1913 Eng Saf-160/10 A Barnes S.F         1 26.5- 9- 56- 8 W  73
0461 1958 Ind Win-222/10 H Gupte S.P        S 1 34.3-11-102- 9 *  86
1878 2008 Eng Nzl-123/10 H Anderson J.M       2 21.3- 8- 43- 7 W  86
0788 1976 Eng Ind-122/10 A Lever J.K          2 23.0- 6- 46- 7 W  94
0424 1956 Win Nzl-157/ 9 A Atkinson D.S.t.E S 3 40.0-21- 53- 7 *  95
1804 2006 Slk Eng-190/10 A Muralitharan M   S 4 30.0-11- 70- 8 W 106
0323 1950 Win Eng-312/10 A Valentine A.L    S 1 50.0-14-104- 8 * 110
0765 1975 Win Aus-169/10 A Roberts A.M.E      3 18.4- 3- 54- 7 W 115
1377 1997 Aus Eng-180/10 A McGrath G.D        1 21.0- 4- 76- 7 * 115
0039 1893 Eng Aus-269/10 H Lockwood W.H       2 37.3-11-101- 6 = 119
1443 1999 Ind Pak-207/10 H Kumble A         S 4 26.3- 9- 74-10 W 119
0754 1975 Eng Aus-304/10 A Underwood D.L    S 1 38.4- 3-113- 7 * 122
1583 2002 Slk Zim-236/10 H Muralitharan M   S 1 40.0-19- 51- 9 W 130
0083 1905 Eng Aus-188/10 H Bosanquet B.J.T  S 4 32.4- 2-107- 8 W 137
0990 1984 Eng Win-245/10 H Botham I.T         2 27.4- 6-103- 8 * 142
1029 1985 Nzl Aus-179/10 A Hadlee R.J         1 23.4- 4- 52- 9 W 144
1028 1985 Slk Pak-295/10 A de Mel A.L.F       2 22.0- 1-109- 6 * 156
0428 1956 Eng Aus-205/10 H Laker J.C        S 3 51.2-23- 53-10 W 160
0975 1984 Nzl Eng-463/10 H Cairns B.L         2 45.0-10-143- 7 = 239
1110 1988 Aus Win-349/ 9 H Hughes M.G         3 37.0- 9- 87- 8 * 247
1513 2000 Pak Eng-480/ 8 H Saqlain Mushtaq  S 1 74.0-20-164- 8 = 288
0913 1981 Aus Pak-500/ 8 H Yardley B        S 1 66.0-16-187- 7 * 388
0235 1934 Aus Eng-627/ 9 A O'Reilly W.J     S 1 59.0- 9-189- 7 = 404
This table has been ordered by the aggregate of runs scored by the top six batsmen dismissed by the bowler. This is an indication of the mayhem which was caused by the bowler. Gillespie's decimation of the West Indian top order, including Brian Lara, reads like this: 6, 0, 4, 0, 4, 0. Looks like a telephone number or a T20 over. See how far ahead Gillespie is of McGrath, whose numbers are 9, 1, 17, 27, 1, 0. Spare a thought for O'Reilly, who was first in the previous classification and is now last. The top six English batsmen scored 52, 63, 0, 4, 132, 153.
Now the bowlers who out-performed their compatriots hundreds of times, okay by more than 12.5 times.
5. Bowling out-performers: many times the rest of the team
MtId Year For Vs  Score HA Bowler          BT I <--Analysis--> R BAvg TAvg Ratio

1630 2002 Win Bng- 87/10 A Lawson J.J.C       3  6.5- 4-  3- 6 W  0.5  18.2 36.5
1720 2004 Aus Ind-205/10 A Clarke M.J       S 3  6.2- 0-  9- 6 *  1.5  48.0 32.0
0290 1947 Aus Ind- 58/10 H Toshack E.R.H      2  3.1- 1-  2- 5 W  0.4  10.8 27.0
0799 1977 Win Pak-180/10 H Croft C.E.H        1 18.5- 7- 29- 8 W  3.6  68.0 18.8
0348 1952 Ind Eng-266/10 H Mankad M.H       S 1 38.5-15- 55- 8 W  6.9 100.0 14.5
0527 1962 Win Ind-187/10 H Gibbs L.R        S 3 53.3-37- 38- 8 W  4.8  67.5 14.2
1210 1993 Aus Win-146/10 H May T.B.A        S 3  6.5- 3-  9- 5 *  1.8  24.6 13.7
0294 1948 Aus Ind-277/10 H Lindwall R.R       3 22.1- 4- 38- 7 W  5.4  72.3 13.3
1899 2008 Aus Saf-281/10 H Johnson M.G        2 24.0- 4- 61- 8 *  7.6 101.5 13.3
0781 1976 Win Eng-435/10 A Holding M.A        2 33.0- 9- 92- 8 W 11.5 151.5 13.2
0047 1896 Eng Saf- 30/10 A Lohmann G.A        4  8.1- 5-  7- 8 W  0.9  11.5 13.1
0823 1978 Win Aus-290/10 H Holder V.A         2 13.0- 4- 28- 6 W  4.7  61.2 13.1
1275 1994 Aus Eng-323/10 H Warne S.K        S 4 50.2-22- 71- 8 W  8.9 113.0 12.7
0129 1912 Aus Eng-175/10 A Hazlitt G.R      S 3 21.4- 8- 25- 7 *  3.6  45.0 12.6
0743 1974 Eng Pak-226/10 H Underwood D.L    S 3 34.5-17- 51- 8 =  6.4  80.0 12.5
Jermaine Lawson's 6 for 3 had an average of 0.5. His fellow bowlers captured 4 for 73 and the out-performance ratio is a whopping 36.5. Clarke's equally amazing 6 for 9 had an out-performer ratio of 32.0 and Ernie Toshack's unbelievable spell of 5 for 2 against India, ended with a ratio of 27.0. These three are bizarre performances. Colin Croft's is a genuine case of out-performance. 8 for 29 against 2 for 136, resulting in a ratio of 18.8. Mankad, the peerless Indian all-rounder captured 8 for 55 against 2 for 200. Shane Warne's 8 for 71 against 2 for 226 is an all-time classic. One would have expected Muralitharan present in this table. However he appears quite a few times in earlier tables but not in this one.
Next is an important variation of the top order wicket captures.
6. Based on difference between batting average and runs scored
MtId Year For Vs  Score HA Bowler          BT I <--Analysis--> R T7W Diff Avg

1906 2009 Win Eng- 51/10 H Taylor J.E         3  9.0- 4- 11- 5 W  5  216 43.3
1756 2005 Aus Eng-155/10 A McGrath G.D        2 18.0- 5- 53- 5 W  5  193 38.6
1971 2010 Pak Eng-446/10 A Mohammad Aamer     1 28.0- 6- 84- 6 *  5  190 38.0
1974 2010 Nzl Ind-266/10 A Martin C.S         3 27.0- 8- 63- 5 =  5  190 38.0
2016 2011 Aus Saf- 96/10 A Watson S.R         2  5.0- 2- 17- 5 *  5  183 36.6
1931 2009 Eng Aus-160/10 H Broad S.C.J        2 12.0- 1- 37- 5 W  5  179 35.8
0652 1969 Nzl Win-417/10 H Motz R.C           1 36.0- 3-113- 5 =  5  177 35.3
1615 2002 Pak Aus-127/10 A Shoaib Akhtar      3  8.0- 2- 21- 5 *  4  181 45.3
0755 1975 Eng Aus-152/10 A Lever P            1 14.4- 2- 38- 6 W  4  175 43.8
1278 1994 Win Ind-114/10 A Benjamin K.C.G     4 17.0- 3- 65- 5 W  4  171 42.8
1104 1988 Pak Aus-165/10 H Iqbal Qasim      S 2 39.0-24- 35- 5 W  4  166 41.6
0303 1948 Eng Aus-389/10 H Hollies W.E      S 2 56.0-14-131- 5 *  4  165 41.3
0255 1936 Eng Aus- 58/10 A Allen G.O.B        4  8.0- 0- 36- 5 W  4  164 41.0
1823 2006 Ind Saf- 84/10 A Sreesanth S        2 10.0- 3- 40- 5 W  4  163 40.7
This is based on the dismissals of top-7 batsmen. The bowlers who captured at least 4 wickets are considered. For each such bowler, I have compiled the sum of the difference between the batting average and the runs scored by the batsman. This has been averaged and we get the notional runs saved. This table lists the bowlers whose average runs saved value is greater than 35/40 depending on whether the bowler captured 5/4 wickets. Jerome Taylor's once-in-a-lifetime effort of 5 for 15 is on top. He dismissed Strauss (9), Cook (0), Pietersen (1), Collingwood (1) and Prior (0). The total batting average of these five batsmen was 227.5 and the saved runs average worked out to 43.3.
McGrath captured the wickets of Trescothick (4), Strauss (2), Vaughan (3), Bell (6) and Flintoff (0). The total of batting averages for these five comes to 208, leading to a runs saved value of 38.6. Shoaib Akhtar dismissed Ponting (7), M.Waugh( (0), S.Waugh (0) and Gilchrist (5). The total batting average was 192.5, leading to a runs saved value of 45.3. Shoaib Akhtar's and McGrath's performances were also away.
Martin's was during the 15 for 5 debacle of India and Watson's was on that manic November Thursday at Newlands.
Let us now look at bowling performances in bat-fests. The match RpW value here applies to the top-7 batsmen only.
7. Bowling performances in matches with high RpW values: > 50.0
MtId Year For Vs  Score HA Bowler          BT I <--Analysis--> R MatRpW

0781 1976 Win Eng-435/10 A Holding M.A        2 33.0- 9- 92- 8 W  50.2
1680 2004 Ind Aus-474/10 A Kumble A         S 2 46.5- 7-141- 8 =  60.2
0416 1955 Ind Nzl-326/10 H Gupte S.P        S 2 76.4-35-128- 7 =  54.5
0564 1964 Aus Eng-611/10 A McKenzie G.D       2 60.0-15-153- 7 =  66.9
0235 1934 Aus Eng-627/ 9 A O'Reilly W.J     S 1 59.0- 9-189- 7 =  54.5
1981 2010 Aus Eng-260/10 H Siddle P.M       S 1 16.0- 3- 54- 6 =  52.5
0781 1976 Win Eng-203/10 A Holding M.A        4 20.4- 6- 57- 6 W  50.2
0404 1955 Aus Win-382/10 A Lindwall R.R       1 24.5- 3- 95- 6 =  52.3
1981 2010 Eng Aus-481/10 A Finn S.T           2 33.4- 1-125- 6 =  52.5
1831 2007 Eng Win-437/10 H Panesar M.S      S 2 36.1- 3-129- 6 =  50.5
1810 2006 Slk Saf-434/10 H Muralitharan M   S 3 64.0-11-131- 6 W  52.3
1912 2009 Pak Slk-606/10 H Umar Gul           1 37.0- 2-135- 6 =  59.7
0450 1958 Win Pak-328/10 H Atkinson E.S.t.E   1 21.0- 7- 42- 5 W  56.2
0274 1939 Win Eng-352/10 A Constantine L.N    1 23.1- 2- 75- 5 =  50.7
1681 2004 Saf Win-427/10 H Nel A              2 28.1- 8- 87- 5 =  53.2
1816 2006 Win Pak-357/10 A Taylor J.E         1 26.0- 6- 91- 5 =  50.3
1303 1995 Win Eng-454/10 A Ambrose C.E.L      1 42.0-10- 96- 5 =  59.5
1034 1986 Ind Aus-396/10 A Yadav N.S        S 2 62.3-21- 99- 5 =  53.1
0271 1939 Eng Saf-530/10 A Perks R.T.D        1 54.4- 5-100- 5 =  56.6
1891 2008 Ind Aus-577/10 H Sehwag V         S 2 40.0- 9-104- 5 =  52.9
1148 1990 Eng Ind-454/10 H Fraser A.R.C       2 39.1- 9-104- 5 W  51.7
1614 2002 Ind Eng-515/10 A Harbhajan Singh  S 1 38.4- 6-115- 5 =  51.7
0744 1974 Pak Eng-545/10 A Intikhab Alam    S 2 51.4-14-116- 5 =  53.9
1850 2007 Ind Pak-456/10 H Harbhajan Singh  S 2 45.5- 9-122- 5 =  54.4
1911 2009 Eng Win-749/ 9 A Swann G.P          2 50.4- 8-165- 5 =  81.4
These are heart-breakers. However most of these performances have been in drawn matches, as the qualification criteria suggests. The stand-out performance is Michael Holding's 8 for 92 and 6 for 57 on an Oval shirt-front pitch, possibly the greatest match bowling performance ever. He, almost certainly more than Viv Richards, was responsible for the fine West Indian win. Harbhajan Singh has held his own on the flat wickets twice, the only bowler to do so, other than Holding. Virender Sehwag is an unlikely name in this table. Now for a unique table. I would not spoil the fun. Pl see the table.
8. They captured 5 and only 5 wickets: but nos 7 to 11
MtId Year For Vs  Score HA Bowler          BT I <--Analysis--> R

1508 2000 Eng Win- 61/10 H Caddick A.R        3 11.2- 5- 14- 5 W
1432 1998 Pak Zim-183/10 H Saqlain Mushtaq  S 1 13.5- 3- 32- 5 =
1431 1998 Aus Eng-191/10 H Gillespie J.N      3 15.2- 2- 88- 5 W
0949 1983 Win Ind-174/10 H Roberts A.M.E      3 24.3- 9- 39- 5 W
0608 1966 Win Eng-240/10 A Sobers G.St.A      2 19.3- 4- 41- 5 W
Other fifers
1755 2005 Slk Win-113/10 H Muralitharan M   S 3 21.0- 8- 36- 6 W
1504 2000 Slk Saf-269/10 H Muralitharan M   S 3 35.0- 5- 84- 7 W
1423 1998 Slk Eng-445/10 A Muralitharan M   S 1 59.3-14-155- 7 W
1175 1991 Eng Win-176/10 H Tufnell P.C.R    S 2 14.3- 3- 25- 6 W
1058 1986 Pak Win-211/10 H Imran Khan         3 22.3- 2- 46- 6 =
1040 1986 Nzl Aus-103/10 H Bracewell J.G    S 3 22.0- 8- 32- 6 W
0986 1984 Aus Win-509/10 A Hogg R.M           2 32.4- 4- 77- 6 *
0947 1983 Ind Pak-323/10 A Kapil Dev N        1 30.5- 7- 85- 8 =
0877 1980 Win Nzl-305/10 A Garner J           2 36.2-15- 56- 6 =
0725 1973 Win Eng-255/10 A Boyce K.D          4 21.1- 4- 77- 6 W
0703 1972 Ind Eng-200/10 H Chandrasekhar B. S 2 41.5-18- 79- 8 *
0463 1959 Win Ind-154/10 A Gilchrist R        3 21.0- 7- 55- 6 W
0436 1957 Saf Eng-254/10 H Tayfield H.J     S 3 50.3-14- 69- 8 =
0250 1936 Aus Saf- 98/10 A Grimmett C.V     S 3 19.5- 9- 40- 7 W
0075 1902 Saf Aus-296/10 H Llewellyn C.B      2 22.0- 3- 92- 6 =
These bowlers captured fifers, no doubt. But they also captured the LAST five wickets. And, to boot, these were the ONLY 5 wickets captured by the first five them. Don't think it is easy to do that. Some other bowler could spoil the fun. One batsman could remain not out. Everything has to work. This leaves us with just 5 bowlers, almost all of recent vintage. It is ironic that Gillespie appears at the top of the top-6 wickets list and also here. If I did not have the ONLY 5 wickets criteria, there are quite a few, 20 in all, who fit in. However these other 13 bowlers have had the satisfaction of capturing one or more top order wickets. Muralitharan appears thrice here indicating the way he dominated the late order batting.
Now for those who toiled for hours on end. These are fifers in innings of 600+ runs.
9. Bowling on and on and on ... in 600+ innings
MtId Year For Vs  Score HA Bowler          BT I <--Analysis--> R

0193 1930 Win Eng-849/10 H Scott O.C        S 1 80.2-13-266- 5 =
0198 1930 Eng Aus-695/10 H Peebles I.A.R    S 2 71.0- 8-204- 6 *
0740 1974 Ind Eng-629/10 A Bedi B.S         S 1 64.2- 8-226- 6 *
0564 1964 Aus Eng-611/10 A McKenzie G.D       2 60.0-15-153- 7 =
0235 1934 Aus Eng-627/ 9 A O'Reilly W.J     S 1 59.0- 9-189- 7 =
0279 1946 Eng Aus-645/10 A Wright D.V.P     S 1 58.2- 4-167- 5 *
1911 2009 Eng Win-749/ 9 A Swann G.P          2 50.4- 8-165- 5 =
0970 1983 Aus Pak-624/10 H Lillee D.K         2 50.2- 8-171- 6 =
0851 1979 Ind Eng-633/ 5 A Kapil Dev N        1 48.0-15-146- 5 *
1079 1987 Eng Pak-708/10 H Dilley G.R         1 47.3-10-154- 6 =
0645 1969 Aus Win-616/10 H Connolly A.N       3 45.2- 7-122- 5 =
1852 2007 Pak Ind-626/10 A Yasir Arafat       1 39.0- 5-161- 5 =
0945 1983 Ind Pak-652/10 A Kapil Dev N        2 38.4- 3-220- 7 *
0259 1937 Eng Aus-604/10 A Farnes K           1 38.1- 5- 96- 6 *
1912 2009 Pak Slk-606/10 H Umar Gul           1 37.0- 2-135- 6 =
1935 2009 Slk Ind-642/10 A Herath HMRKB     S 1 33.0- 2-121- 5 *
0989 1984 Eng Win-606/10 H Pringle D.R        2 31.0- 5-108- 5 *
0304 1948 Ind Win-631/10 H Rangachari C.R     1 29.4- 4-107- 5 =
This table is ordered by balls bowled. Scott bowled a third of the team overs. Lucky he got a couple of wickets in the end. Peculiar match. A timeless Test, which was drawn, by agreement. West Indies fall behind by 577 runs and England bat again. Then Headley's famous 223 saves the match. 9 days, and no result. A follow-on and they might very well have won by an innings. I know Shri might have something to say: but strange captaincy by Hon.FSG Calthorpe, the lone "gentleman" in the team. Over 9 days, he scored 13, bowled 4 overs and batted when he should have bowled. Commendable are McKenzie and Kapil Dev who captured 7 wickets amongst the batting mayhem although Kapil went for nearly 6 runs per over, thanks to four Pakistani centuries. Also noteworthy is Farnes' capturing 6 for 96 out of a 600+ total.
Now for some nice alternate tables. First is the one where the bowlers have been very economical.
10. 5-wkt bowling performances with RpO less than 1.0
MtId Year For Vs  Score HA Bowler          BT I <--Analysis--> R  RpO

0527 1962 Win Ind-187/10 H Gibbs L.R        S 3 53.3-37- 38- 8 W 0.71
0212 1931 Aus Saf-170/10 H Ironmonger H       2 47.0-29- 42- 5 W 0.89
0413 1955 Pak Nzl-124/10 H Zulfiqar Ahmed   S 3 46.3-21- 42- 6 W 0.90
0479 1959 Aus Pak-134/10 A Mackay K.D         3 45.0-27- 42- 6 W 0.93
1104 1988 Pak Aus-165/10 H Iqbal Qasim      S 2 39.0-24- 35- 5 W 0.90
0413 1955 Pak Nzl-164/10 H Zulfiqar Ahmed   S 1 37.2-19- 37- 5 W 0.99
0785 1976 Ind Nzl-141/10 H Bedi B.S         S 4 33.0-18- 27- 5 W 0.82
1113 1989 Win Aus-401/10 A Marshall M.D       2 31.0-16- 29- 5 * 0.94
0025 1887 Eng Aus- 97/10 A Barnes W           4 30.4-29- 28- 6 W 0.91
1394 1998 Slk Zim-140/10 H Muralitharan M   S 2 29.0-18- 23- 5 W 0.79
0277 1946 Eng Ind-170/10 H Pollard R          2 27.0-16- 24- 5 = 0.89
0593 1965 Eng Nzl-166/10 H Titmus F.J       S 3 26.0-17- 19- 5 W 0.73
0456 1958 Eng Nzl- 67/10 H Laker J.C        S 1 22.0-11- 17- 5 W 0.77
0707 1973 Aus Pak-106/10 H Walker M.H.N       4 21.2- 8- 15- 6 W 0.70
0250 1936 Aus Saf-157/10 A O'Reilly W.J     S 1 21.0-11- 20- 5 W 0.95
0434 1956 Eng Saf- 72/10 A Bailey T.E         4 20.4- 6- 20- 5 W 0.97
0009 1882 Eng Aus- 63/10 H Barlow R.G         1 20.4-22- 19- 5 * 0.92
1516 2000 Aus Win- 82/10 H McGrath G.D        1 20.0-12- 17- 6 W 0.85
0381 1954 Saf Nzl- 79/10 H Tayfield H.J     S 2 18.4- 7- 13- 6 W 0.70
1156 1990 Ind Slk- 82/10 H Raju S.L.V       S 2 17.5-13- 12- 6 W 0.67
0681 1971 Eng Nzl- 65/10 A Underwood D.L    S 1 15.4- 7- 12- 6 W 0.77
0212 1931 Aus Saf-117/10 H Wall T.W           3 15.1- 7- 14- 5 W 0.92
0906 1981 Eng Aus-121/10 H Botham I.T         4 14.0- 9- 11- 5 W 0.79
1687 2004 Eng Win- 47/10 A Harmison S.J       3 12.3- 8- 12- 7 W 0.96
0047 1896 Eng Saf- 30/10 A Lohmann G.A        4  8.1- 5-  7- 8 W 0.86
0216 1932 Aus Saf- 36/10 H Ironmonger H       1  7.2- 5-  6- 5 W 0.82
1630 2002 Win Bng- 87/10 A Lawson J.J.C       3  6.5- 4-  3- 6 W 0.44
0290 1947 Aus Ind- 58/10 H Toshack E.R.H      2  3.1- 1-  2- 5 W 0.63
These are matches in which the number of overs bowled are greater than the number of runs conceded. This is ordered by the number of overs bowled. The table is led by Gibbs who had a RpO value of 0.71 while bowling 53 overs and capturing 8 wickets. Is it is possible today ? Look at Marshall's performance, the stand-out one amongst this lot. Out of an Australian total of 401, he captures 5 for 29, at an RpO of 0.94, while his compatriots capture 5 for 338, at an RpO figure of 2.1. In fact he just misses out on the out-performer table, with a ratio of 11.7. Lohmann's 8 for 7 has appeared in various tables. Only point of question would be the dicey quality of South African batting and the minefields he bowled on. Now for the final table in this first part article. The two extreme sets of fifers.
11. The two extremes of 5-wkt bowling performances
MtId Year For Vs  Score HA Bowler          BT I <--Analysis--> R

0193 1930 Win Eng-849/10 H Scott O.C        S 1 80.2-13-266- 5 =
0371 1953 Ind Win-576/10 A Mankad M.H       S 2 82.0-17-228- 5 =
0740 1974 Ind Eng-629/10 A Bedi B.S         S 1 64.2- 8-226- 6 *
0945 1983 Ind Pak-652/10 A Kapil Dev N        2 38.4- 3-220- 7 *
1892 2008 Aus Ind-441/10 A Krejza J.J         1 43.5- 1-215- 8 *
1336 1996 Zim Pak-553/10 A Strang P.A       S 2 69.0-12-212- 5 =
0198 1930 Eng Aus-695/10 H Peebles I.A.R    S 2 71.0- 8-204- 6 *
0503 1961 Pak Ind-539/ 9 A Haseeb Ahsan     S 2 84.0-19-202- 6 =
...
...
...
1720 2004 Aus Ind-205/10 A Clarke M.J       S 3  6.2- 0-  9- 6 *
1210 1993 Aus Win-146/10 H May T.B.A        S 3  6.5- 3-  9- 5 *
0047 1896 Eng Saf- 30/10 A Lohmann G.A        4  8.1- 5-  7- 8 W
0153 1924 Eng Saf- 30/10 H Gilligan A.E.R     2  6.3- 4-  7- 6 W
0216 1932 Aus Saf- 36/10 H Ironmonger H       1  7.2- 5-  6- 5 W
1630 2002 Win Bng- 87/10 A Lawson J.J.C       3  6.5- 4-  3- 6 W
0290 1947 Aus Ind- 58/10 H Toshack E.R.H      2  3.1- 1-  2- 5 W
This is the one table which contains the two ends of the bowling spectrum. Fifers for 200 runs and above and fifers for 10 runs and below. Most of these bowlers have already appeared in the earlier tables and this is just a different classification. Spare a thought for poor Krejza. On debut he toils hard with a 8-for-million performance and then is forgotten. Barring table 8, which points to a slightly negative aspect of bowlers, in which Muralitharan appears three times, he has appeared 10 times in the other 11 tables. This may not be conclusive but is a pointer to the range and depth of his bowling achievements. Lohmann, no surprise, appears 8 times. Signs of the times he bowled in. Two bowlers, contrasting in their teams' strengths, McGrath and Kapil, appear 7 times each. Wasim and Waqar appear very few times. That is a sign of the way they shared the spoils.
' Nice Guys Finish Last'
I didn't get where I am today by being nice...
Monday, 05 December 2011
It is a phrase that millions of good-natured people around the world will consider so obvious that it hardly deserves to be questioned. Nonetheless, a team of business experts claims to have proved the pessimistic notion that "nice guys finish last" – at least where money is concerned.
A study has found that a person's "agreeableness" has a negative
effect on their earnings. "Niceness", according to the research
published in the Journal of Personality and Social Psychology, does not
appear to pay.
"This issue isn't really about whether people are nasty or nice," said Richard Newton, business author and consultant. "A better way of putting it might be a willingness to fight your corner."
While agreeable traits such as compliance, modesty and altruism may seem conducive to a good working atmosphere, the study found that managers are more likely to fast-track for promotion and pay rises "disagreeable" people – those more likely to "aggressively advocate for their position".
The study, by Beth A Livingston of Cornell University, Timothy A Judge of the University of Notre Dame and Charlice Hurst of the University of Western Ontario, interviewed 9,000 people who entered the labour force in the past decade about their career, and gave personality tests which were then measured against income data.
The findings are bad news for nice guys, but worse still for women of all temperaments. They show that, regardless of their levels of agreeableness, women earned nearly 14 per cent less than men. Agreeable men earned an average of $7,000 (£4,490) less than their disagreeable peers.
"Nice guys do not necessarily finish last, but they do finish a distant second in terms of earnings," the study noted. "Our research provides strong evidence that men earn a substantial premium for being disagreeable while the same behaviour has little effect on women's income." Reasons offered for the difference include a better success rate for disagreeable types when negotiating pay rises, suggesting stubbornness is a key for success.
It's not how you begin...Players who failed to light up their debuts but went on to shine later in their careers
by Steven Lynch
 Feeds: Steven Lynch
|
|||
Related Links
Players/Officials:
Marvan Atapattu
| Shane Warne
| Sir Leonard Hutton
| Sir Viv Richards
| Merv Hughes
| Graham Gooch
| Michael Holding
| Jeff Thomson
| Gautam Gambhir
| Brad Hogg
| Saeed Anwar
|
|||
Marvan Atapattu
As an opening batsman you can't do much worse than begin your Test career with scores of 0 and 0, 0 and 1, and 0 and 0 (and, reports suggest, even that one run was actually a leg-bye). That was the nightmare start that Sri Lanka's Atapattu endured in three Tests from 1990 to early 1994. It was - perhaps not surprisingly - more than three years before he got another game, when at last he got into double figures. But he did very well after that, finishing a 90-Test career with 5502 runs and 16 centuries, no fewer than six of them doubles.
As an opening batsman you can't do much worse than begin your Test career with scores of 0 and 0, 0 and 1, and 0 and 0 (and, reports suggest, even that one run was actually a leg-bye). That was the nightmare start that Sri Lanka's Atapattu endured in three Tests from 1990 to early 1994. It was - perhaps not surprisingly - more than three years before he got another game, when at last he got into double figures. But he did very well after that, finishing a 90-Test career with 5502 runs and 16 centuries, no fewer than six of them doubles.
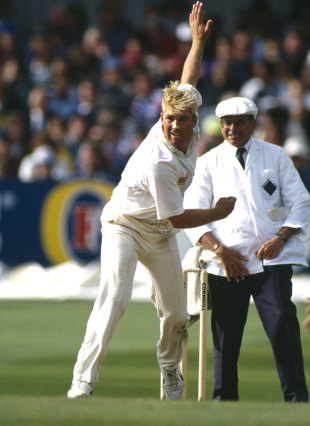
Shane Warne
In January 1992, when Warne was rather rounder than he is today - Ian Healy commented back then that Warnie's idea of a balanced diet was a cheeseburger in each hand - the great legspinner made an undistinguished Test debut in Sydney, taking one Indian wicket for 150 in 45 overs: his victim was Ravi Shastri, out to what Wisden called "a tired shot" after having amassed 206 in 572 minutes. After no wickets in the next Test, and 0 for 107 in the first innings of his third one, in Colombo in August 1992, Warne had a bowling average of 335.00 when he was handed the ball again in the second innings as Sri Lanka closed in on a probable victory. Suddenly things started to get better: he secured an unlikely win, taking three wickets for no run in 11 deliveries. The rest, as they say, is history.
In January 1992, when Warne was rather rounder than he is today - Ian Healy commented back then that Warnie's idea of a balanced diet was a cheeseburger in each hand - the great legspinner made an undistinguished Test debut in Sydney, taking one Indian wicket for 150 in 45 overs: his victim was Ravi Shastri, out to what Wisden called "a tired shot" after having amassed 206 in 572 minutes. After no wickets in the next Test, and 0 for 107 in the first innings of his third one, in Colombo in August 1992, Warne had a bowling average of 335.00 when he was handed the ball again in the second innings as Sri Lanka closed in on a probable victory. Suddenly things started to get better: he secured an unlikely win, taking three wickets for no run in 11 deliveries. The rest, as they say, is history.
Len Hutton
England tried out a new opening pair against New Zealand for the first Test against New Zealand at Lord's in 1937. James Parks (the father of the 1960s England wicketkeeper Jim) made 22 and 7, while a young Yorkshireman - he celebrated his 21st birthday on the rest day - made 0 and 1. Only one of them was named for the next Test - and, you've guessed it, it was Hutton who was retained. He scored 100 at Old Trafford, and the following year made 364 against Australia: in all he won 79 caps, and scored nearly 7000 runs. Poor Parks, however, never played another Test.
England tried out a new opening pair against New Zealand for the first Test against New Zealand at Lord's in 1937. James Parks (the father of the 1960s England wicketkeeper Jim) made 22 and 7, while a young Yorkshireman - he celebrated his 21st birthday on the rest day - made 0 and 1. Only one of them was named for the next Test - and, you've guessed it, it was Hutton who was retained. He scored 100 at Old Trafford, and the following year made 364 against Australia: in all he won 79 caps, and scored nearly 7000 runs. Poor Parks, however, never played another Test.
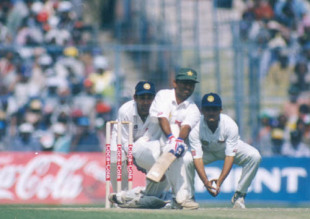
Viv Richards
One of the most intimidating batsmen of all time, Richards made a less than scintillating start in Tests, managing only 4 and 3 against India in Bangalore in 1974-75, falling in each innings to the whirling legspin of Bhagwat Chandrasekhar. But any thoughts of a weakness against spin were banished in the next Test, in Delhi, where Richards slammed six sixes in an imperious 192 not out to set up an innings victory. That was the first of 24 Test centuries for the "Master Blaster".
One of the most intimidating batsmen of all time, Richards made a less than scintillating start in Tests, managing only 4 and 3 against India in Bangalore in 1974-75, falling in each innings to the whirling legspin of Bhagwat Chandrasekhar. But any thoughts of a weakness against spin were banished in the next Test, in Delhi, where Richards slammed six sixes in an imperious 192 not out to set up an innings victory. That was the first of 24 Test centuries for the "Master Blaster".
Merv Hughes
After taking just one wicket for 123 in his first Test, against India, Hughes was pasted all round the Gabba by Ian Botham in the 1986-87 Ashes opener. After the next Test Merv had a bowling average nudging 50, and hadn't even looked like scoring a run. You'd have got long odds on him achieving the Test double of 1000 runs and 100 wickets, but he turned himself into a serviceable batsman and did just that. And his bowling improved out of sight too: he finished up with 212 Test wickets, most of them celebrated by squeezing a few well-chosen words through that famous bushy moustache in the general direction of the departing batsman. Probably Hughes' greatest sledge came not long after Pakistan's Javed Miandad had labelled him "a fat bus conductor". A few balls later Hughes dismissed him, and charged past, yelling "Tickets please!"
After taking just one wicket for 123 in his first Test, against India, Hughes was pasted all round the Gabba by Ian Botham in the 1986-87 Ashes opener. After the next Test Merv had a bowling average nudging 50, and hadn't even looked like scoring a run. You'd have got long odds on him achieving the Test double of 1000 runs and 100 wickets, but he turned himself into a serviceable batsman and did just that. And his bowling improved out of sight too: he finished up with 212 Test wickets, most of them celebrated by squeezing a few well-chosen words through that famous bushy moustache in the general direction of the departing batsman. Probably Hughes' greatest sledge came not long after Pakistan's Javed Miandad had labelled him "a fat bus conductor". A few balls later Hughes dismissed him, and charged past, yelling "Tickets please!"
Graham Gooch
On his Test debut against Australia at Edgbaston in 1975, Gooch had a moustache to rival Merv's - and his batting was as productive as Hughes' in his early Tests. Gooch departed for 0 and 0, tickling a couple of catches to the predatory Rod Marsh, and after one more match returned to county cricket for three years to tighten things up. He re-emerged, tightness personified, to kickstart a Test career that ultimately brought him 8900 runs, still the England record.
On his Test debut against Australia at Edgbaston in 1975, Gooch had a moustache to rival Merv's - and his batting was as productive as Hughes' in his early Tests. Gooch departed for 0 and 0, tickling a couple of catches to the predatory Rod Marsh, and after one more match returned to county cricket for three years to tighten things up. He re-emerged, tightness personified, to kickstart a Test career that ultimately brought him 8900 runs, still the England record.
Michael Holding
We remember Holding now as just about the perfect fast bowler - athletic, graceful, and above all scarily fast. But it wasn't all plain sailing at first: he took 0 for 127 in his debut Test, in Australia in 1975-76, and finished that chastening series - which the Aussies won 5-1 - with just 10 wickets at 61.40, being reduced to tears at one point as things went against him. Things began to look up later in 1976, though, when Holding blew England away with 14 wickets on a slow pitch at The Oval. "Whispering Death" had arrived.
We remember Holding now as just about the perfect fast bowler - athletic, graceful, and above all scarily fast. But it wasn't all plain sailing at first: he took 0 for 127 in his debut Test, in Australia in 1975-76, and finished that chastening series - which the Aussies won 5-1 - with just 10 wickets at 61.40, being reduced to tears at one point as things went against him. Things began to look up later in 1976, though, when Holding blew England away with 14 wickets on a slow pitch at The Oval. "Whispering Death" had arrived.
Jeff Thomson
One reason the England tourists Down Under in 1974-75 didn't take much notice of Thomson's pre-series bluster about how much he liked to hurt batsmen was that they knew he had played just one previous Test, against Pakistan in 1972-73, and finished with 0 for 110 in 19 expensive overs. But what Mike Denness and Co. probably didn't know was that Thommo had been nursing a broken foot in that match - he thought he'd better play, in case he never got another chance. The next call duly came in Brisbane two years later, and Thomson shook England up with 6 for 46 in the second innings, then 5 for 93 in Perth in the next Test, both of which Australia won comfortably. By the time he ruled himself out of the series by injuring his shoulder playing tennis, Thommo had taken 33 wickets in four and a half matches, and the Ashes were back in Australian hands. He ended up with 200 Test wickets, exactly 100 of them against England.
One reason the England tourists Down Under in 1974-75 didn't take much notice of Thomson's pre-series bluster about how much he liked to hurt batsmen was that they knew he had played just one previous Test, against Pakistan in 1972-73, and finished with 0 for 110 in 19 expensive overs. But what Mike Denness and Co. probably didn't know was that Thommo had been nursing a broken foot in that match - he thought he'd better play, in case he never got another chance. The next call duly came in Brisbane two years later, and Thomson shook England up with 6 for 46 in the second innings, then 5 for 93 in Perth in the next Test, both of which Australia won comfortably. By the time he ruled himself out of the series by injuring his shoulder playing tennis, Thommo had taken 33 wickets in four and a half matches, and the Ashes were back in Australian hands. He ended up with 200 Test wickets, exactly 100 of them against England.
|
|||
Gautam Gambhir
Test stardom - and multi-million IPL contracts - probably seemed a long way off for Gambhir after his first Test for India, against Australia in Mumbai in November 2004, produced scores of 3 and 1 on an admittedly dodgy pitch (India won in three days, bowling Australia out for 93 in their second innings). The selectors stuck by Gambhir, who repaid them by making 96 in the next Test, against South Africa, and 139 against Bangladesh a few weeks later. Despite trouble with injuries, he now has more than 3500 Test runs.
Test stardom - and multi-million IPL contracts - probably seemed a long way off for Gambhir after his first Test for India, against Australia in Mumbai in November 2004, produced scores of 3 and 1 on an admittedly dodgy pitch (India won in three days, bowling Australia out for 93 in their second innings). The selectors stuck by Gambhir, who repaid them by making 96 in the next Test, against South Africa, and 139 against Bangladesh a few weeks later. Despite trouble with injuries, he now has more than 3500 Test runs.
Brad Hogg
Cricket's most famous ex-postman made his Test debut in Delhi in October 1996, replacing Shane Warne, who was recovering from surgery to his hand. Hogg, an unorthodox left-arm spinner, had an undistinguished start: his 17 overs cost 69, although he did claim the wicket of Sourav Ganguly. He didn't play another Test for six and a half years, although he did have a long run in Australia's one-day side. One story has it that Hogg had longed all his career to hear Ian Healy growl from behind the stumps, "Well bowled, Hoggy" ... but bowled so indifferently that it was never actually said.
Cricket's most famous ex-postman made his Test debut in Delhi in October 1996, replacing Shane Warne, who was recovering from surgery to his hand. Hogg, an unorthodox left-arm spinner, had an undistinguished start: his 17 overs cost 69, although he did claim the wicket of Sourav Ganguly. He didn't play another Test for six and a half years, although he did have a long run in Australia's one-day side. One story has it that Hogg had longed all his career to hear Ian Healy growl from behind the stumps, "Well bowled, Hoggy" ... but bowled so indifferently that it was never actually said.
Saeed Anwar
Given Pakistan's capricious selection policies, the deliciously wristy opener Anwar might never have played again after he bagged a pair in his first Test, against West Indies in Faisalabad in November 1990. As it was, he didn't win another Test cap for more than three years - but made it count when he did, with 169 against New Zealand in only his third match. Anwar ended up with 4052 runs in Tests - and more than double that (8824) in one-day internationals.
Given Pakistan's capricious selection policies, the deliciously wristy opener Anwar might never have played again after he bagged a pair in his first Test, against West Indies in Faisalabad in November 1990. As it was, he didn't win another Test cap for more than three years - but made it count when he did, with 169 against New Zealand in only his third match. Anwar ended up with 4052 runs in Tests - and more than double that (8824) in one-day internationals.
Steven Lynch is the editor of the Wisden Guide to International Cricket 2011.
© ESPN EMEA Ltd.
Friday, 25 November 2011
Is there room for intellectuals in cricket?
Ed Smith in Cricinfo 24/11/2011
WG Grace thought reading books was bad for your batting. "You'll never
catch me that way," he scoffed. The story serves as a metaphor for
sport's suspicion of intellectual life. Thinkers, readers, curious
minds: do we really want them clogging up the supposedly optimistic,
forward-looking atmosphere of a cricket team?
Cricket is still grappling with the terrible news that Peter Roebuck -
one of sport's genuine intellectuals - jumped to his death from his
hotel balcony as he was being questioned by South African police about a
sexual assault charge. The circumstances of Roebuck's death were
clearly atypical. Nonetheless, his life - especially those parts of his
life that belonged to cricket - fit the pattern of an intellectual who
never quite settled into an easy relationship with the sport he loved.
Other sports are arguably even more anti-intellectual than cricket.
Football never entirely understood Pat Nevin. Graeme Le Saux was
subjected to homophobic chants and abuse. He wasn't gay, of course - his
"sin" was to read serious newspapers such as the Guardian.
In Ball Four, the New York Yankees pitcher Jim Bouton's wrote the
first great exposé of major league sport. He described how the
management encouraged, almost forced, their players to drink beer after
matches. That Bouton preferred milk was thought to be proof that he
wasn't a real bloke. He was made to feel guilty for being intellectually
curious. Bouton wrote admiringly about one soulmate who liked to lie
down in open fields and read poetry. But his intellectual team-mate
subsequently denied it.
Let's not pretend that there aren't tensions between thinking and
competing. I turned professional at probably my most openly intellectual
phase, when I had just graduated from Cambridge University. Perhaps too
many things had all happened too soon for me - I was only 20 when I
graduated. And we were young and callow and could be a pretentious
bunch, with the intellectual bar set ludicrously high. We thought
nothing of being habitually dismissive - forgive us, but being
dismissive was the style.
From that rarefied academic environment, dominated by abstract thinking
and academic competitiveness, I stepped straight into a first-class
cricket dressing room. It was a massive change and gave me a huge jolt.
And I'm sure I didn't always handle it well. On one away trip, my
room-mate picked up the book on my bedside table. It was Experience and Its Modes, a densely argued book by the philosopher Michael Oakeshott. I'll never forget the expression on his face.
Mike Atherton and I once discussed whether intellectuals had any place
in modern sport. The best defence is that good sports teams embrace
diversity. They are open to all different types, including players who
do not naturally fit the stereotype of a team player. The best teams are
liberal in the deepest sense. They do not stifle independent thinkers
or left-field ideas. They do not enforce conventional, middle-brow
behaviour.
For that reason, the worst combination for a sporting intellectual is a
losing team and a weak, insecure captain. A losing team searches for
scapegoats. During times of insecurity and pressure, as history shows,
human groups often turn on unconventional individuals. Insecure leaders
want to be surrounded by players of limited intelligence. It is easier
that way.
Surprisingly, however, the team's "intellectual" usually has little to
fear from the anti-intellectual jocks. No, the real threat comes from
the jealousy of the nearly man, the player who fancies himself as a
thinker and resents the competition. Team splits often begin with the
manipulations of jealous, thwarted players who think they are cleverer
than they are.
| The best teams are liberal in the deepest sense. They do not stifle independent thinkers or left-field ideas | |||
Winning, of course, always helps. A winning team is more inclined to
look for the good in unusual players. Looking back on my career, the
happiest times were when I played under secure captains and coaches. My
father, a lifelong teacher, often told me that weak headmasters appoint
unthreatening deputies, but strong headmasters back themselves to handle
more restless and independent people. I suspect that was one of Adam
Hollioake's great strengths as a captain: he encouraged people to be
themselves. He could do that because he was happy in his own skin. "I
enjoy my life, I want my team-mates to enjoy theirs" - that was always
the impression I got from Adam.
Roebuck, I sense, craved that kind of acceptance - in cricket and in
life. He once emailed me a long, uncorrected series of acute perceptions
and observations. It was classic Roebuck - staccato, direct and
unsparing, especially of himself. He wrote: "I realised that I had not
actually enjoyed cricket at all. Englishmen love to suffer! I played one
creative innings at Somerset and that's the only press cutting I kept. I
never really dared again."
He was determined to avoid those errors in his career as a writer.
"Always tell the truth in your own way. As a journalist I never go into
the office, as I say nothing happens in offices! One has to work hard
not to get sucked into 'the operation'. But dare one tread that path? Do
you? Professionalism is not an enemy but it has become a mantra. I
concentrate entirely in staying fresh - or else work becomes tired,
cynical, useless. Cleverness is an easy substitute for thought. Begin
afresh afresh as Larkin wrote."
That "Do you?" was one of the most direct challenges I have had put to me.
He had so much more thinking to do, so many more insights to develop.
Instead, his innings did not run its full and proper course. "A player
goes through three stages - natural, complicated, simple - not many
reach that last stage but the journey cannot be avoided. Failure is the
problem," he wrote to me.
Roebuck's three-stage journey applies to life as well as to batting. It
is deeply sad that Roebuck's life ended while it was still very much at
the complicated stage. One day, I hope, the intellectual will find it
easier to find a natural role in professional sport.
Former England, Kent and Middlesex batsman Ed Smith is a writer with the Times.
Wednesday, 23 November 2011
Only builders will profit from Cameron's sub-prime homes
Simon Jenkins, The Guardian, 23/11/2011
After the SS British Economy hit an iceberg three years ago, survivors were hauled from the freezing sea aboard the good ship Cameron. They assumed he'd be a more reliable helmsman. So what should they make of their new captain deciding to hurl his vessel at full speed towards the self-same iceberg?
David Cameron announced on Monday that he wants to "revive people's hopes and dreams of homeownership". He intends to use up to £650m of public money to reflate what is by definition the sub-prime end of the mortgage market. Public money will this time bail out not reckless bank mortgage lending, but reckless sales to individuals by private housebuilders. It is called kickstart, which is coalition speak for bailout.
Magic gold dust is the stock in trade of the politics of housing. Cameron, like all leaders exhilarating in spending public money, accords the owning of a home (cosy word for house) the status his forebears gave the church. He speaks spiritually of "that magic moment when you get the key and walk into your own flat". It is a dream, he says, "which should be available for everyone, not just the better off". His government wants to meet that hope and realise that dream.
With ministers said to be panicking about growth, every lobby in the country is rushing to town waving bottles of snake oil. Few are as powerful or persuasive as the housebuilders, sharing with bankers a responsibility for the world's current woes. The Guardian on Monday listed six almost identical housing initiatives in recent years. This kickstart is eerily similar to Labour's explicit Kickstart Housing Delivery plan of 2009, with the same subsidies for undeveloped sites and the same £400m incentives package. On each occasion the lobbyists come away with money in their pockets – but with the housing market unmoved. The market tracks not Whitehall initiative but the level of demand in the economy, and this tracking is as constant as government's belief in its power to break it.
On Monday the eager-beaver housing minister, Grant Shapps, indulged in the usual mission creep. "It is not a multimillion-pound expense," he said, which is what it is. The policy is to be "industry-led", with housebuilders "buying into the scheme". This is no wonder when they wrote the rules to enable them to profit risk-free. It is a lobbyist's charter.
There is some new help for renovating existing and derelict properties and some welcome land disposals, but no sign of an end to tax discrimination against repairs and conversions, where big gains in housing capacity are to be found. There is just an incantation of the developers' slogan that 230,000 homes are "needed nationwide", as if a home were a unit in a Leninist housing pool, rather than a flexible concept in a market responding to demand and supply.
There is no shortage of houses in Britain, indeed there is a raw surplus. Many are just too expensive for those who want to live in them. This is hardly new. Every chart of housebuilding and prices suggests that both will start turning up soon, along with mortgage availability, irrespective of government subsidy. The one thing that will send prices into a speculative spiral is a reckless return to Thatcher-style mortgage subsidies and Blair-style sub-prime lending.
The proper use of public money on housing is on the very poor. Here the policy is mystifying. Shapps asserts a hitherto unknown "right" of social tenants to buy the houses they rent. He is offering a 50% discount on the estimated purchase price, thus giving away half the value of the public housing stock, regardless of whether its not-for-profit owners agree. So much for localism and the "big society". This will be exacerbated by a little noticed concession to the housebuilders, releasing them from past promises to supply social housing on already permitted sites. This astonishing capitulation makes a mockery of planning localism.
Social housing remains hopelessly ill-defined in Britain, where 60,000 of its beneficiaries reportedly have second homes and hundreds of thousands more are well-off. Shapps even asserts a social right to a subsidised house near where one's parents live. When the Victorian social reformer, Octavia Hill, launched "three percent philanthropy" to aid the urban poor, she too was aiming away from real need. As Gareth Stedman-Jones wrote in Outcast London, Hill was helping not the truly desperate but a politically emergent class of "deserving poor". The same applied to municipal housing. Only after the second world war was access to a subsidised house loaded in favour of real need.
Under Margaret Thatcher housing subsidy wheeled upmarket, to promote homeownership. Tax relief was explicitly deployed as a means of sucking wage earners into homeownership (and Tory voting). The memoirs of Tory chancellors Lord Howe and Lord Lawson blaze with arguments with Thatcher on this. To her, subsidies were not to relieve housing distress but to aid those heroes of stability and growth, the deserving poor and middling rich. Housing politics has been skewed upmarket ever since.
Today's constant reference to the plight of young people "struggling to get on the housing ladder" reflects the reckless politics of the sub-prime crisis. It humiliated renting, inflated house prices, impoverished young people and ruined thousands in a frenzy of the "homeownership" bubble. Home owning peaked at 70% of Britons, against between 40% and 55% in Germany, France and the Netherlands. It leached savings from the economy and made British workers starkly immobile, compared with Germans or Japanese.
Much could be done to raise the status and availability of renting. The balance of security of tenure has tilted too far from tenant to landlord. Tilting it back could be balanced by fiscal incentives for converting and subletting. The latest kickstart echoes the cliches and slogans of the 1990s and 2000s, inducing hundreds of thousands on both sides of the Atlantic to sink their savings in to properties they could not afford.
The message is toxic. Even if the government is underpinning the housebuilders' side of the bargain, and the
money would be better spent on housing the poor, people should not be encouraged to borrow beyond their means in another gamble on rising prices. Sub-prime was an error more grotesque in its consequence than any could have foreseen. No responsible government should head that way again.
Subscribe to:
Posts (Atom)