Ben Chu in The Independent
Big numbers are all around us, shaping our political debates, influencing the way we think about things. For instance we hear a great deal about the prodigious size of the national debt: £1,603bn in July according to the latest official statistics.
There has been a proliferation of stories about the aggregate deficit of pension schemes, which has jumped to an estimated £1trn in the wake of the Brexit vote. And how could we forget that record net migration figure of 333,000, which figured so prominently in the recent European Union referendum campaign?
Yet there are other massive numbers we seldom hear about. The Office for National Statistics published some estimates for the “national balance sheet” last week. This is the place to look if you want really big numbers. They showed that the aggregate value of the UK’s residential housing stock in 2015 was £5.2 trillion – that’s up £350bn in just 12 months. A lot of people are a lot wealthier than they were a year ago.
That’s property wealth. What about the total value of households’ financial assets? According to the ONS, that stands at £6.2 trillion – up £113bn over the year. It will be even higher since the Brexit vote. Why? Because those ballooning pension scheme deficits we hear about represent a part of the financial assets of households.
Incidentally, a majority of the national debt, indirectly, represents a financial asset of UK households too. We often forget that for every financial liability there has to be a financial asset.
There’s still a good deal of handwringing in some quarters about the supposedly excessive borrowing of the state. But we don’t tend to hear anything about the debt of the corporate sector these days. The ONS reports that the total debt (loans and bonds combined) of British-based companies in 2015 was £1.35 trilion, pretty much where it was back in 2010.
If debt is something to get excited about, shouldn’t company borrowing be a cause for concern? Not, of course, if companies are borrowing to increase their productive capacities.
Actually, the major problem with corporate balance sheets lies in a different area. The ONS data shows that the corporate sector’s overall stocks of cash rose to £581bn in 2015, up £41bn on last year and a sum representing an astonishing 31 per cent of our GDP. It should be seriously worrying that firms are still choosing to keep so much cash on their balance sheets at a time when we badly need them to invest.
We tend to fret about the wrong big numbers. Consider the data on the liabilities of UK-based financial institutions. If you want a large number try this: £20.5 trillion. And around a quarter of these are financial derivative contracts. Many of those companies are foreign firms with UK operations. But UK banks – which we taxpayers still effectively underwrite because they are “too big to fail” – have aggregate liabilities worth £7.5 trillion.
That’s around four times larger than our GDP, yet Mark Carney, the Governor of the Bank of England, has rather strangely suggested he would be comfortable with that figure eventually rising to nine times national income.
Sometimes we fail to appreciate what lies behind the big numbers that shape our debates. The headlines this week said total UK employment grew by 172,000 in the three months to June. But this only tells one part of the story. Other data from the ONS showed that 478,000 people without jobs got them in the quarter, while 317,000 people entered the ranks of the unemployed. That headline figure is a net change in employment figure. And this wasn’t an unusually busy quarter for the jobs market.
This churn goes on constantly, with hundreds of thousands of us leaving jobs and hundreds of thousands taking new ones. The economic threat from the Brexit vote aftermath isn’t just people being made redundant – it’s a slowdown in hiring and that mighty labour market churn.
There’s a similar issue with those ubiquitous net migration figures. Newspapers talk of immigration creating “a new city the size of Newcastle each year” (or some variation on that line). That is rhetoric designed to stir public anxiety.
Yet that’s in context of an estimate of 36 million tourist visits to the UK each year, flows equal to half of the British population. And there are double the number of tourists visits going the other way each year.
What these big numbers emphasise is that we live in a mind-bendingly busy, complex and internationally connected economy. The figures we hear about, and which pundits fixate upon, are often the differences between two, or sometimes more, very large numbers. That bigger context should not be ignored.
The economic risks and fragilities of our economy are not always where we’re invited to believe they are.
Showing posts with label statistics. Show all posts
Showing posts with label statistics. Show all posts
Tuesday, 23 August 2016
Tuesday, 19 July 2016
Mexico cuts poverty at a stroke – by changing the way it measures earnings
Change in methodology by national statistics institute provokes scepticism after it shows Mexico’s poor are richer by a third compared with last year

A girl stands in a slum in Mexico City. Mexico’s poor may not be feeling better off despite the latest report from the national statistics institute. Photograph: Alamy Stock Photo
David Agren in The Guardian
Mexico’s impoverished masses were up to 33.6% richer in 2015 than the previous year, according to the state-run statistics service.
But the change owes less to a sudden increase in actual wealth and wellbeing for the country’s poor than to unannounced changes in the methodology for measuring household earnings.
The changes make comparing poverty rates from one year to the next impossible – something acknowledged by the National Geography and Statistics Institute (Inegi).
But the tweak will allow image-conscious politicians to claim success in their anti-poverty programs and economic stewardship, even though public discontent over stagnant wages and rising prices remains widespread.

Pope's focus on violence and poor likely to make for 'uncomfortable' Mexico visit
“Basically what the Inegi is saying is: we’ve been overestimating poverty levels,” said Jonathan Heath, an independent economist in Mexico City.
“The way that they did this” – without public consultation – “raises suspicion,” he added.
“The new poverty numbers are certainly going to fall by a significant amount and it’s not due to improvements, it’s not due to government action, it’s not due to anything. It’s due to the way Inegi has carried out this survey,” he said.
The methodological changes were revealed on Friday with the release of the 2015 edition of the Survey of Socioeconomic Conditions, which showed an overall real increase of 11.9% in household earnings. In some states, the increase was more than 30%, while the poorest Mexicans saw the biggest gain in earnings, according to Inegi.
The changes came as a complete surprise to social scientists and non-governmental groups, but were justified by Inegi as an attempt at obtaining a truer measure of poverty – a notoriously tricky undertaking as people tend to underreport their incomes.
Inegi said in a statement that it applied new criteria in the collection and review of field data, which allows it to “offer society and the State a more precise measure of household earnings”.
Measuring poverty has proved controversial in Mexico, where social programs are often criticized as vote-buying exercises and beneficiaries in some states are told erroneously that their benefits are conditional on supporting the party in power.
Mexico used to measure poverty based on income, but changed its methodology in 2008 to take a “multidimensional” measure based on six social necessities, according to Heath.
The information collected by Inegi is provided to the National Council for the Evaluation of Social Development Policy (Coneval), an agency responsible for measuring poverty rates and the performance of social programs. Coneval put the poverty rate at 46.2% of the population in 2014, an increase of 0.7% points from 2012.
“[The] changes lack public technical documents to justify them,” Coneval said in a statement. It added the increase in household earnings “is not congruent with the trend that has been shown in other Inegi documents and with other economic variables”.
David Agren in The Guardian
Mexico’s impoverished masses were up to 33.6% richer in 2015 than the previous year, according to the state-run statistics service.
But the change owes less to a sudden increase in actual wealth and wellbeing for the country’s poor than to unannounced changes in the methodology for measuring household earnings.
The changes make comparing poverty rates from one year to the next impossible – something acknowledged by the National Geography and Statistics Institute (Inegi).
But the tweak will allow image-conscious politicians to claim success in their anti-poverty programs and economic stewardship, even though public discontent over stagnant wages and rising prices remains widespread.
Pope's focus on violence and poor likely to make for 'uncomfortable' Mexico visit
“Basically what the Inegi is saying is: we’ve been overestimating poverty levels,” said Jonathan Heath, an independent economist in Mexico City.
“The way that they did this” – without public consultation – “raises suspicion,” he added.
“The new poverty numbers are certainly going to fall by a significant amount and it’s not due to improvements, it’s not due to government action, it’s not due to anything. It’s due to the way Inegi has carried out this survey,” he said.
The methodological changes were revealed on Friday with the release of the 2015 edition of the Survey of Socioeconomic Conditions, which showed an overall real increase of 11.9% in household earnings. In some states, the increase was more than 30%, while the poorest Mexicans saw the biggest gain in earnings, according to Inegi.
The changes came as a complete surprise to social scientists and non-governmental groups, but were justified by Inegi as an attempt at obtaining a truer measure of poverty – a notoriously tricky undertaking as people tend to underreport their incomes.
Inegi said in a statement that it applied new criteria in the collection and review of field data, which allows it to “offer society and the State a more precise measure of household earnings”.
Measuring poverty has proved controversial in Mexico, where social programs are often criticized as vote-buying exercises and beneficiaries in some states are told erroneously that their benefits are conditional on supporting the party in power.
Mexico used to measure poverty based on income, but changed its methodology in 2008 to take a “multidimensional” measure based on six social necessities, according to Heath.
The information collected by Inegi is provided to the National Council for the Evaluation of Social Development Policy (Coneval), an agency responsible for measuring poverty rates and the performance of social programs. Coneval put the poverty rate at 46.2% of the population in 2014, an increase of 0.7% points from 2012.
“[The] changes lack public technical documents to justify them,” Coneval said in a statement. It added the increase in household earnings “is not congruent with the trend that has been shown in other Inegi documents and with other economic variables”.
Monday, 18 July 2016
A nine-point guide to spotting a dodgy statistic

Boris Johnson did not remove the £350m figure from the Leave campaign bus even after it had been described as ‘misleading’. Photograph: Stefan Rousseau/PA
David Spiegelhalter in The Guardian
I love numbers. They allow us to get a sense of magnitude, to measure change, to put claims in context. But despite their bold and confident exterior, numbers are delicate things and that’s why it upsets me when they are abused. And since there’s been a fair amount of number abuse going on recently, it seems a good time to have a look at the classic ways in which politicians and spin doctors meddle with statistics.
Every statistician is familiar with the tedious “Lies, damned lies, and statistics” gibe, but the economist, writer and presenter of Radio 4’s More or Less, Tim Harford, has identified the habit of some politicians as not so much lying – to lie means having some knowledge of the truth – as “bullshitting”: a carefree disregard of whether the number is appropriate or not.
So here, with some help from the UK fact-checking organisation Full Fact, is a nine-point guide to what’s really going on.
Use a real number, but change its meaning
There’s almost always some basis for numbers that get quoted, but it’s often rather different from what is claimed. Take, for example, the famous £350m, as in the “We send the EU £350m a week” claim plastered over the big red Brexit campaign bus. This is a true National Statistic (see Table 9.9 of the ONS Pink Book 2015), but, in the words of Sir Andrew Dilnot, chair of the UK Statistics Authority watchdog, it “is not an amount of money that the UK pays to the EU”. In fact, the UK’s net contribution is more like £250m a week when Britain’s rebate is taken into account – and much of that is returned in the form of agricultural subsidies and grants to poorer UK regions, reducing the figure to £136m. Sir Andrew expressed disappointment that this “misleading” claim was being made by Brexit campaigners but this ticking-off still did not get the bus repainted.

George Osborne quoted the Treasury’s projection of £4,300 as the cost per household of leaving the EU. Photograph: Matt Cardy/Getty Images
Make the number look big (but not too big)
Why did the Leave campaign frame the amount of money as “£350m per week”, rather than the equivalent “£19bn a year”? They probably realised that, once numbers get large, say above 10m, they all start seeming the same – all those extra zeros have diminishing emotional impact. Billions, schmillions, it’s just a Big Number.
Of course they could have gone the other way and said “£50m a day”, but then people might have realised that this is equivalent to around a packet of crisps each, which does not sound so impressive.
George Osborne, on the other hand, preferred to quote the Treasury’s projection of the potential cost of leaving the EU as £4,300 per household per year, rather than as the equivalent £120bn for the whole country. Presumably he was trying to make the numbers seem relevant, but perhaps he would have been better off framing the projected cost as “£2.5bn a week” so as to provide a direct comparison with the Leave campaign’s £350m. It probably would not have made any difference: the weighty 200-page Treasury report is on course to become a classic example of ignored statistics.

Recent studies confirmed higher death rates at weekends, but showed no relationship to weekend staffing levels. Photograph: Peter Byrne/PA
Casually imply causation from correlation
In July 2015 Jeremy Hunt said: “Around 6,000 people lose their lives every year because we do not have a proper seven-day service in hospitals….” and by February 2016 this had increased to “11,000 excess deaths because we do not staff our hospitals properly at weekends”. These categorical claims that weekend staffing was responsible for increased weekend death rates were widely criticised at the time, particularly by the people who had done the actual research. Recent studies have confirmed higher death rates at weekends, but these showed no relationship to weekend staffing levels.
Choose your definitions carefully
On 17 December 2014, Tom Blenkinsop MP said, “Today, there are 2,500 fewer nurses in our NHS than in May 2010”, while on the same day David Cameron claimed “Today, actually, there are new figures out on the NHS… there are 3,000 more nurses under this government.” Surely one must be wrong?
But Mr Blenkinsop compared the number of people working as nurses between September 2010 and September 2014, while Cameron used the full-time-equivalent number of nurses, health visitors and midwives between the start of the government in May 2010 and September 2014. So they were both, in their own particular way, right.

‘Indicator hopper’: Health secretary Jeremy Hunt. Photograph: PA
Use total numbers rather than proportions (or whichever way suits your argument)
In the final three months of 2014, less than 93% of attendances at Accident and Emergency units were seen within four hours, the lowest proportion for 10 years. And yet Jeremy Hunt managed to tweet that “More patients than ever being seen in less than four hours”. Which, strictly speaking, was correct, but only because more people were attending A&E than ever before. Similarly, when it comes to employment, an increasing population means that the number of employed can go up even when the employment rate goes down. Full Fact has shown how the political parties play “indicator hop”, picking whichever measure currently supports their argument.

Is crime going up or down? Don’t ask Andy Burnham. Photograph: PA
Don’t provide any relevant context
Last September shadow home secretary Andy Burnham declared that “crime is going up”, and when pressed pointed to the police recording more violent and sexual offences than the previous year. But police-recorded crime data were de-designated as “official” statistics by the UK Statistics Authority in 2014 as they were so unreliable: they depend strongly on what the public choose to report, and how the police choose to record it.
Instead the Crime Survey for England and Wales is the official source of data, as it records crimes that are not reported to the police. And the Crime Survey shows a steady reduction in crime for more than 20 years, and no evidence of an increase in violent and sexual offences last year.
Exaggerate the importance of a possibly illusory change
Next time you hear a politician boasting that unemployment has dropped by 30,000 over the previous quarter, just remember that this is an estimate based on a survey. And that estimate has a margin of error of +/- 80,000, meaning that unemployment may well have gone down, but it may have gone up – the best we can say is that it hasn’t changed very much, but that hardly makes a speech. And to be fair, the politician probably has no idea that this is an estimate and not a head count.
Serious youth crime has actually declined, but that’s not because of TKAP. Photograph: Action Press / Rex Features
Prematurely announce the success of a policy initiative using unofficial selected data
In June 2008, just a year after the start of the Tackling Knives Action Programme (TKAP), No 10 got the Home Office to issue a press release saying “the number of teenagers admitted to hospital for knife or sharp instrument wounding in nine… police force areas fell by 27% according to new figures published today”. But this used unchecked unofficial data, and was against the explicit advice of official statisticians. They got publicity, but also a serious telling-off from the UK Statistics Authority which accused No 10 of making an announcement that was “corrosive of public trust in official statistics”. The final conclusion about the TKAP was that serious youth violence had declined in the country, but no more in TKAP areas than elsewhere.

Donald Trump: ‘Am I going to check every statistic?’
Photograph: Robert F. Bukaty/AP
If all else fails, just make the numbers up
Last November, Donald Trump tweeted a recycled image that included the claim that “Whites killed by blacks – 81%”, citing “Crime Statistics Bureau – San Francisco”. The US fact-checking site Politifact identified this as completely fabricated – the “Bureau” did not exist, and the true figure is around 15%. When confronted with this, Trump shrugged and said, “Am I going to check every statistic?”
Not all politicians are so cavalier with statistics, and of course it’s completely reasonable for them to appeal to our feelings and values. But there are some serial offenders who conscript innocent numbers, purely to provide rhetorical flourish to their arguments.
We deserve to have statistical evidence presented in a fair and balanced way, and it’s only by public scrutiny and exposure that anything will ever change. There are noble efforts to dam the flood of naughty numbers. The BBC’s More or Less team take apart dodgy data, organisations such as Full Fact and Channel 4’s FactCheck expose flagrant abuses, the UK Statistics Authority write admonishing letters. The Royal Statistical Society offers statistical training for MPs, and the House of Commons library publishes a Statistical Literacy Guide: how to spot spin and inappropriate use of statistics.
They are all doing great work, but the shabby statistics keep on coming. Maybe these nine points can provide a checklist, or even the basis for a competition – how many points can your favourite minister score? In my angrier moments I feel that number abuse should be made a criminal offence. But that’s a law unlikely to be passed by politicians.
David Spiegelhalter is the Winton Professor of the Public Understanding of Risk at the University of Cambridge and president elect of the Royal Statistical Society
Monday, 20 June 2016
The Conservatives are giving us a masterclass in how not to govern
Zoe Williams in The Guardian
There is always a rueful moment following a Conservative election victory, disappointment tinged with the consolation that at least they’ll be solid. Sure, they will want to march back to a time of Victorian certainties, where if you lose it’s because you’re a loser, and if you win, it’s because you goddamn tried. But at least they will captain their vessel with competence and assurance. We might not like where it’s going, but at least we won’t drown.
Consider what good a government of any party can do, if it takes the business of statecraft seriously. It is within its power to solve the housing crisis: not chuck lump sums at the already privileged, but to undertake a building programme of breadth and vision that would change lives. It is easily within a government’s scope to make plans for energy and carbon emissions, half a century into the future. It is within a government’s purview to think radically about what people need, in order to feel optimistic about the future: not just a health service, but a great health service; not just pensions but proper social care; not just benefits but genuine security. All the life-changing architecture of citizenship has been undertaken by good government, thinking decades beyond the electoral cycle, with dreams infinitely greater than personal power.
That’s what is really crushing about our current situation: not that the political landscape was permanently scarred by a brutal act last week; not that we’ve been invited to unleash some pointless vandalism on the EU on the basis of lies from its most ardent proponents; not that all of us have been dragged into a vicious battle between ideas so hollow and limited – free-market fundamentalism versus the same with added racism – that you wouldn’t want to be detained by them for five minutes eavesdropping on the bus, let alone see them obliterate everything else in the public discourse. No, the really dispiriting thing is that we haven’t got a government.
When they’re good, governments embody civility; they can take the instinctive care that we have for one another and turn it into something solid, whether that’s a street light or a tax credit; they can turn hopes into plans; they can make people’s lives better. There were times before this referendum when it may have seemed preferable to have a government doing nothing to one as socially destructive as David Cameron’s. But it would be wrong to lose faith in politics altogether, because of the terrifying spectacle of people doing it wantonly. It is time to remind ourselves what good government can do.
Governments, when they are solid, maintain standards in public life. They do not panic when they’re criticised by the Daily Mail in the middle of a parliamentary term, or when a more radical party such as Ukip seems to be peeling off voters. They do not throw up their hands and offer referendums on amorphous, incomprehensible matters, because they do not sacrifice the stability of the nation for the sake of their own party, and they would not drag a whole continent into their squalid leadership battle.
But if that’s a little specific, let’s frame it more broadly: good governments insist on the decent and truthful use of statistics. They can’t enforce this – they can’t imprison their opponents for making up bogus numbers, and repeating them until half the country believes that they’re true. They can’t do much to insist that the press doesn’t twist or misrepresent the facts, doesn’t stir up hatred with relentless falsification. They can’t even make it a law, I shouldn’t think, that every time a newspaper lies about a foreigner, it has to print the correction with the same prominence as the lie. That would be far too intrusive, a bit too Leveson-y.
Yet a good government will set standards. It will tell the truth itself, and it will be trenchant about accuracy from others. It will not pander, and when it sees racist propaganda material it will say so. No general election has ever been as ugly as this referendum, as personal, as vitriolic, as full of accusations of mendacity, so that the casual voter basically has to guess who is telling the truth by how fast they’re talking and the look in their eyes (although this does give one pretty reliable answer: not Michael Gove). Good governments respect the institutions that provide sound and impartial analysis – universities, the civil service, statistics authorities – and advance their work, rather than routinely falling foul of it themselves.
Good governments, even in the teeth of internecine squabbling, continue to govern: they don’t announce a complete overhaul of prisons, then luxuriate in a six-month hiatus and leave the service wondering whether it was ever meant to be seen through. They don’t part-privatise probation and then lose interest, they don’t try to academise every school and realise the senselessness of that halfway through; they don’t pick a fight with the whole NHS that takes innumerable man-hours to solve and yields nothing but lasting unpleasantness.
Six months ago, this was, it was argued, all the opposition’s fault; a party with a slim majority was behaving like a party with a huge majority, because it knew it would face no resistance. It’s for another conversation whether the opposition has improved, but the question is moot anyway; there is nothing to oppose. The business of governing has ground to a halt, and in its place we find men arguing over whose exaggeration is the most egregious and who looks too scruffy for public life.
This is not the time to lose faith in politics; there has never been a more urgent time to rekindle faith. Remember what politics can do. We cannot conclude, from this sad episode, that its glory days are over.
Tuesday, 19 April 2016
These are the psychological tricks both sides of the EU debate are playing on you - and how to recognise them
What sounds worse: a shortfall of 6 per cent of GDP resulting from Brexit, or a loss of £4,300 per household?
Ben Chu in The Independent
Imagine you’re lucky. Imagine you receive £50 from a benefactor. But, oh dear, there’s a problem with the gift. It turns out too much was paid out. There has to be a financial correction. So you’re faced with a choice.
So would you rather keep £20? Or lose £30? Think very quickly. Did you initially lean towards keeping £20? Many people do. But of course they amount to the same thing. You’d still have £20 whichever option you picked.
So what’s going on? Why did £20 look more appealing? That’s the brain’s “system one” at work, according to psychologists. Studies show that the reactive human mind sees the “keep” flashing in red lights before there’s any mental arithmetic (even before trivial calculations such as subtracting £30 from £50). And the word “loss” is also deeply off-putting to the mind’s system one. A quick decision framed as a straight choice between “keep” and “lose” will usually see “lose” rejected.
The mental arithmetic is “system two” and it takes much longer to be activated in most of us than system one. Sadly, many of us don’t even bother activating system two before making decisions at all.
Advertisers are aware of this bias. That’s why they often frame propositions in terms of how much money people can keep rather than how much they’ve lost in the past. “Keep more of your savings income by opening an ISA”, “Keep more of your money when you shop with us”, and so on.
Political advertisers are on to it too. That’s why the Leave campaign ahead of June’s European Union referendum have been emphasising so heavily the prize of keeping the UK’s £13bn annual contribution to the EU Budget. They emphasise what we can keep by voting to leave. Yet the Remain campaign is familiar with this tactic too. That’s why they emphasise the 3m UK jobs “linked to trade with the rest of Europe”. We naturally want to keep all those jobs, don’t we?
Both claims are actually tendentious. The £13bn is the gross contribution of the UK to Brussels – it doesn’t account for the money the UK receives back. And it’s silly to imply that 3m jobs would disappear overnight in the event of a Brexit. That would only happen if all trade between Britain and the Continent came to a sudden halt – something no one seriously expects. But the campaigners are not really trying to impart useful information with their soundbites – they’re aiming at the system one part of your brain.
That’s by no means the only psychological bias battleground in this referendum campaign. Psychologists talk of the power of “framing”. Which sounds more appealing: 90 per cent fat-free or 10 per cent fat? Advertisers know the answer, which is why one never sees the latter formulation even though they describe the same product.
Now consider which sounds like a more compelling argument in the context of an EU membership vote. “Almost half of everything we sell to the rest of the world we sell to Europe,” says the Stronger in Europe campaign. “British reliance on trade with the EU has fallen to an all-time low,” proclaim the Outers. The fact that both sound compelling - and both describe the same statistics - shows that the two campaigns grasp the importance of framing.
There’s more. What sounds worse: a shortfall of 6 per cent of GDP resulting from Brexit, or a loss of £4,300 per household? For many people it will be the latter figure, heavily highlighted by George Osborne yesterday. But, again, they amount to the same thing. £4,300 is merely the 6 per cent of GDP translated into cash terms and divided by all the 26m households in the country.
So why does £4,300 sound more off-putting to most people? Here we have the “ratio bias” at work. In any ratio there is the numerator and the denominator. In the two statistics above “6” and “£4,400” are the numerators. And “GDP” and “per household” are the denominators. Studies show that the system one part of our brain is more sensitive to big numbers in the numerator of ratios, and often neglects the denominators. So £4,300 sets off larger movements in many brains because, quite simply, it’s a bigger sounding figure than 6.
Consider another example. Which is the more compelling fact: “200,000 UK businesses trade with the EU” or: “Only 6 per cent of UK firms export to the EU”? The first is from the Stronger in Europe website. The second is from Vote Leave. Here the Outers are trying to use the ratio bias to minimise the sense of importance of the EU as a trading partner for British firms - and the Inners are doing precisely the opposite.
We are profoundly influenced by the framing of statistics. Quite understandably, politicians and campaigners seek to manipulate your system one brain. “I just feel I don’t know who to trust and I need a voice I can trust,” said a member of a panel of “undecided” referendum voters on the BBC’s Newsnight last night. But that benign and trustworthy figure does not exist. The way the facts are laid out will depend on the way the person wants the facts to be framed. Asking for someone to do the job for you - and placing your trust in them - essentially means asking that person to steer you in one way or the other.
If people genuinely want to make up their minds without bias, they are on their own. And their only trustworthy guide is their own brain’s system two.
Thursday, 21 January 2016
Arguing the toss
Nathan Leamon in Cricinfo
Will awarding the toss to the away team even up the playing field and deliver more away Test wins, or is this yet another case of received cricketing wisdom not stacking up with the facts?
 You will rarely be criticised for choosing to bat. Batting is the default setting; bowling first is seen as the gamble © Getty Images
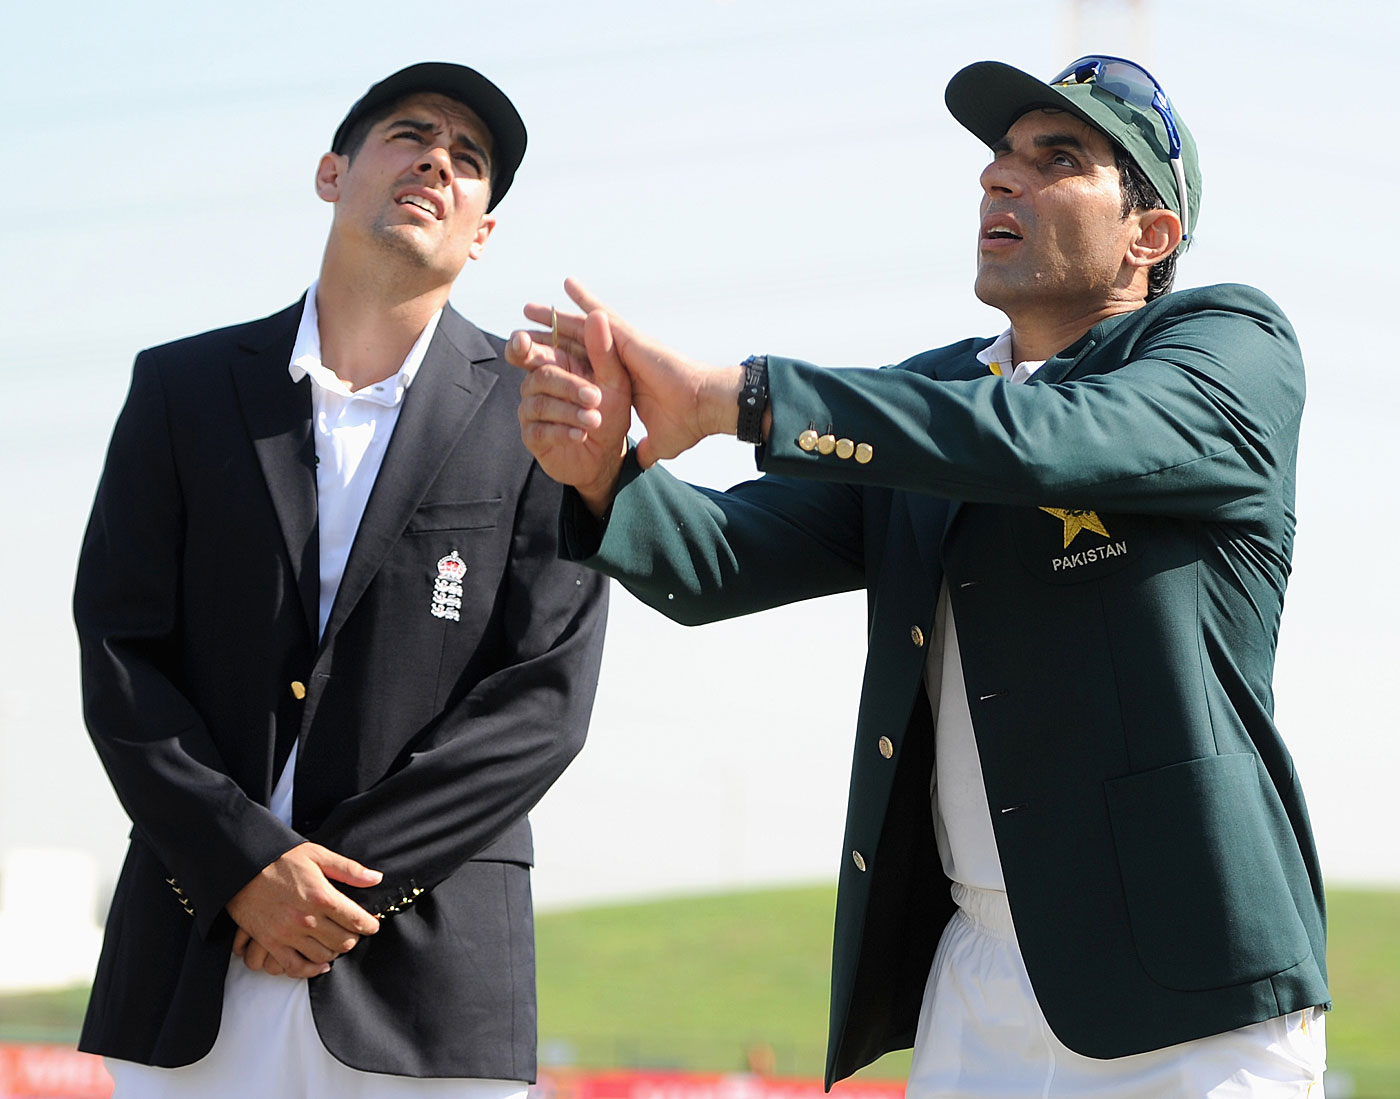
On the first morning of the first Test between Pakistan and England in Abu Dhabi, three events came to mind. One current, one recent, one infamous. The first was the conversation between Michael Atherton and both captains at the toss and the unanimity of all concerned. The second, the recent proposal from Ricky Ponting and Michael Holding amongst others, that the toss be done away with in Test cricket and the choice given instead to the away captain. The other was Brisbane 2002, and Nasser Hussain choosing to bowl first on a day almost as hot as the one in Abu Dhabi.
Let's start with the second. The suggestion of awarding the toss to the away captain was made by Ponting as a possible solution to the perceived problem of home teams tailoring wickets to suit their strengths. And the resulting domination of home teams. "It has never been harder to win away from home", we are told repeatedly.
Ironically, the decline of away wins is one of those facts that is assumed to be true without often, it would seem, being checked. In fact, it has never been easier to win on the road. More Tests are won by the away team now than at any time in recent history.
AWAY WINS IN TESTS
Will awarding the toss to the away team even up the playing field and deliver more away Test wins, or is this yet another case of received cricketing wisdom not stacking up with the facts?
You will rarely be criticised for choosing to bat. Batting is the default setting; bowling first is seen as the gamble © Getty ImagesOn the first morning of the first Test between Pakistan and England in Abu Dhabi, three events came to mind. One current, one recent, one infamous. The first was the conversation between Michael Atherton and both captains at the toss and the unanimity of all concerned. The second, the recent proposal from Ricky Ponting and Michael Holding amongst others, that the toss be done away with in Test cricket and the choice given instead to the away captain. The other was Brisbane 2002, and Nasser Hussain choosing to bowl first on a day almost as hot as the one in Abu Dhabi.
Let's start with the second. The suggestion of awarding the toss to the away captain was made by Ponting as a possible solution to the perceived problem of home teams tailoring wickets to suit their strengths. And the resulting domination of home teams. "It has never been harder to win away from home", we are told repeatedly.
Ironically, the decline of away wins is one of those facts that is assumed to be true without often, it would seem, being checked. In fact, it has never been easier to win on the road. More Tests are won by the away team now than at any time in recent history.
AWAY WINS IN TESTS
Decade Win%
2010s 28.8
2000s 28.4
1990s 23.1
1980s 21.1
1970s 22.7
1960s 21.5
This is largely down to the decline in the draw. There have been more and more results in Tests and although the proportion of them that have gone the way of the visitors has shifted slightly in favour of the home team, this has resulted in a significant rise in away wins.
That said, there are other factors that suggest the balance of power is shifting slightly towards the home team. The gap between averages at home and averages away is growing, for example. So let's assume for now that the premise is true, and that home teams are increasingly dominant.
Holding and Ponting have suggested giving the toss to the visiting captain to prevent home teams stacking the conditions in their favour. I don't know whether this is a good idea or not. But there are three reasons that we should question whether it would achieve its aims.
Firstly, it assumes groundsmen can reliably bake certain characteristics into a pitch. In practice, pitch preparation seems to be an inexact science. I have stood before Test matches around the world and listened to groundsmen describe how the pitch is going to play, only to watch it do something completely different half an hour later.
It also presupposes that the interests of groundsman and home team are aligned, which is often not the case. In England for example, venues are heavily incentivised to maximise revenues from the Tests they host by ensuring five full days' play. So groundsmen, understandably, often pay less attention to the needs of the visiting circus than to the people who pay their salary for the other 51 weeks of the year.
Secondly, there is a law of unintended consequences in sporting rule changes that can often produce the opposite result to the one intended. If a home captain had control over the pitch, the framers of this law are assuming he would back away from tilting it in his favour. Is it not just as likely that he would go the other way and seek to produce a pitch so favourable that the toss was taken out of the equation? This after all is what MS Dhoni openly sought to do when England and Australia each last toured, produce pitches that turn big from ball one, and so take the toss out of the equation. Equally, you could imagine England or Australia producing genuine green-tops that would be as helpful to the quicks on day four as day one.
But lastly, and most importantly, it assumes that captains are able to use the toss to their advantage. This is not in any way proven. In fact the evidence suggests it just isn't the case.
At the time of writing, 1,048 Tests have been played since January 1990. During that period, the side that won the toss has lost slightly more (377) matches than it has won (374). Winning the toss in the modern era appears to give a side no advantage at all.
It wasn't always so. On uncovered pitches, batting first in almost all instances was a robustly successful strategy. If it rained during the match, the pitch would deteriorate, affecting the side batting second disproportionately. Until 1970, the side batting first in a Test won 36 per cent of matches, and lost 28 per cent.
But in the modern era, the advantage of winning the toss seems to have disappeared. This is, of course, stunningly counterintuitive. Test cricket is an asymmetric game. One team bats first, then the other. And the two teams' chances of winning are not equal. The team batting first has different requirements for victory to the team batting second, and the pitch changes over the course of the match, affecting the balance of power between bat and ball. Therefore, we would assume, teams that win the toss can choose the best conditions and so gain an advantage. But they don't. How can that possibly be?
 Dropped catches and a sickening injury to Simon Jones didn't help Nasser Hussain after he chose to bowl in Brisbane in 2002 © Getty Images
Sometimes, a perfectly reasonable response to current circumstances becomes a habit, then a tradition, then an article of faith that outlives the circumstances that created it. We rarely question what we know to be self-evidently true. And so the bias towards batting first seems to have outlived the circumstances that created it by several decades.
"If you win the toss, nine times out of ten you should bat. On the tenth occasion you should think about bowling and then bat."
That was a very successful strategy to adopt for the first century of Test cricket. And one that is still the default setting for most captains. In the 700 Tests played since January 2000, nearly twice as many captains have batted first than have chosen to bowl. Is it still successful?
In a word, no. In that period, the side batting first has won 36 per cent of those Tests, the side bowling first 39 per cent. The bat-first bias at the toss would seem to be neutral at best, and probably counter-productive.
It is still hard to believe that captains aren't able to use the toss to their advantage. There are venues where the evidence is stark. Some pitches clearly favour the side batting first, some the side batting second. In the 40 Tests played in Lahore, the team batting first has won just three. Adelaide by contrast is a classic bat-first venue. It starts as a batsman's paradise, but by the fifth day can be very tricky to bat on, with considerable turn for the spinners. In the 74 Tests played at the ground the side batting first have won 35, the side batting second 19. Since 1990 averages in the first innings are 44.6, in the second 38.9, the third 30.1 and the fourth 27.1 and, as you would expect, in that period, 25 out of 26 captains have chosen to bat first, gaining a considerable advantage in doing so.
These are not isolated cases. Many pitches have similarly skewed characteristics. Galle and Old Trafford for example, both have similar records to Adelaide. Karachi is as bowl-first friendly as Lahore.
****
Captains' behaviour at the toss seems to be yet another example of received cricketing wisdom not concurring with the evidence. Where what teams do doesn't seem to maximise their chances of winning. Why is this the case?
Well, part of the story involves how our brains handle information. There has been a great deal of research into memory and perception, and the results are both surprising and illuminating when it comes to our decision-making in sport. For a start, our memories don't work as you might expect. They are not akin to a videotape; we don't record a series of events and then play them back as and when they are needed.
The disturbing truth is that our unaided recall is not very good. The human brain encodes less than 10 per cent of what we experience, the rest it simply makes up. Our minds construct a narrative around the coded memories we do have that fills in the gaps with a plausible story. Faced with a huge number of random or near random events (a cricket match, for instance) our brains pattern-spot, even when there is no pattern. Our minds look for those events that they can form into a pattern or story, and that becomes the meaning or lesson that we take away from the match. Even if the vast number of events that occurred didn't fit the pattern, we disproportionately remember the ones that did.
At their best then, our memories seem to work along the lines of Albert Camus's description of fiction, they are the lie through which we tell the truth. What we remember didn't actually happen, what we remember is a story that our brains have fabricated, but one that we hope contains the essential truth of what happened in a way that we can understand and retain.
Our fallible memories are only part of the reason captains and coaches behave the way they do. There is another, far more powerful reason to make the choices they make and one which is harder to argue against. For this we need to go back to Brisbane in 2002, and Nasser Hussain choosing to bowl.
"The test of a first-rate intelligence is the ability to hold two opposed ideas in the mind at the same time, and still retain the ability to function." - F. Scott Fitzgerald
It was the first Test of the Ashes, an Australian team were at the peak of their powers and playing at home in 'Fortress Brisbane', the hardest ground in the world to win at as an away team. No visiting team had won in the last 26 Tests played at the 'Gabbattoir'. Hussain won the toss and chose to bowl, Australia were 364-2 by the close of play and went on to win comfortably.
It is no use looking back with hindsight and using that to determine whether a decision was right or wrong. I am sure that if Nasser had known that choosing to bowl first would bring a host of dropped chances, the loss of a bowler to injury and Australia piling up the first-innings runs, he would have chosen to have a look behind door B and strapped his pads on.
But he didn't know, and in evaluating a past decision, we shouldn't know either. We need to remain behind the veil of ignorance, aware of all the potential paths the match could have taken, but ignorant of the one that it did.
One way we can do that is to simulate the match. There are various models that allow us to simulate matches given the playing strengths of the two sides and give probabilities for the outcome. When we do this for that Brisbane Test, we get the following probabilities for England:
Decision Win Draw Lose
Bat First 4% 3% 93%
Bowl First 4% 10% 86%
Every batsman in Australia's top seven for that match finished his career averaging over 45 (three averaged 50-plus), none of the English players did, only two averaged 40. England had a decent bowling attack. Australia had Warne, McGrath and Gillespie with 1,000 wickets between them already.
England were a pretty good side, they'd won four, lost two of their previous 10 matches. But they were hopelessly outgunned, and in alien conditions. Steve Waugh, the Australian captain, was also going to bowl if he had won the toss. If he had done then Australia would almost certainly have won the match as well. Australia were almost certainly going to win regardless of who did what at the toss.
But none of that made any difference. Hussain's decision to bowl first was castigated by the public and press of both countries. Wisden described it as "one of the costliest decisions in Test history". One senior journalist wrote that the decision should prompt the England captain "to summon his faithful hound, light a last cigarette and load a single bullet into the revolver".
For Nasser in Brisbane, read Ricky Ponting at Edgbaston in 2005, another decision to insert the opposition that has never been lived down. Yet, if either of them had batted first and lost, no one would ever remember their decision at the toss. You will rarely if ever be criticised for choosing to bat. Batting is the default setting; bowling first is seen as the gamble. And remember, the side that bats first loses significantly more than it wins.
Test cricket is one of the greatest contests in sport, a brilliant, multi-faceted contest for mind and body. But it is also a game of numbers. If you can tilt the numbers slightly in your favour, get them working for you, not against you, plot a slightly more efficient path to victory, then you are always working slightly downhill rather toiling against the slope.
As I write this, Pakistan are about to go out and bowl for the fourth consecutive day of England's first innings in Abu Dhabi on a pitch that you could land light aircraft on. They have home advantage, have made the orthodox decision, played well, and yet there is only one team that can win the match from here, and it isn't them. If this is what home advantage and winning the toss looks like then they are welcome to it.
It is all but certain that if they had ended up batting second they would now be in a considerably better position. Reverse the first innings as they have happened and Pakistan would now be batting past an exhausted England side and about to put them under the pump for a difficult last three sessions. And in the alternative scenarios where one side or the other got a first innings lead, as we have seen, those work disproportionately in favour of the side batting second.
But, we all do it. We look at a pristine wicket, flat, hard and true, and batting seems the only option. It is written into our cricketing DNA. The evidence may suggest there is a small marginal gain in bowling. But small margins be damned. If the marginal gain erodes your credibility and authority, then that is probably not an exchange you are willing to make. There are tides you can't swim against.
Which brings us back to Alastair Cook and Misbah-ul-Haq, standing in Abu Dhabi in the baking heat. Both are men of considerable character; brave, implacable and preternaturally determined to win. Each has withstood the slings and arrows of captaining their country through some fairly outrageous fortunes. Each is ready to bat first without a second thought. Because while they are certainly brave, they are not stupid. And you would have to be really stupid to make the right decision.
And there of course you have the central problem of much decision-making in cricket. This pitch is slightly different to all the other pitches that there have ever been. And you don't know for certain how it is going to play, or how that will influence the balance of power in the match. There are those who would argue that this is why stats are useless, or at best very limited.
I would agree entirely that stats are never sufficient to make a decision. There is nuance and subtlety to weigh; the brain and eye have access to information that the laptop doesn't. The feel and instincts of coaches and players, the hard-wired learning from decades in the game, contains incredibly valuable information and will always be the mainstay of decision-making that must be flexible and fluid through changing match situations. But if we are honest, we must also accept that the sheer weight and tonnage of what we don't know about how cricket works would sink a battleship. To use stats and nothing else to make decisions would be incredibly foolish, and as far as I am aware no one ever has. But equally, to insist on making decisions on incomplete information, without ever reviewing the effectiveness of those decisions would seem almost equally perverse.
I'm not saying that everyone was wrong in Abu Dhabi. I'm not saying that Misbah should have bowled. The weight of opprobrium heaped on him doesn't bear thinking about. It's the sort of decision that ends captaincies. No, Misbah had only one option and he took it. But maybe, just maybe, one day there will come a time when it isn't such an obvious choice.
2010s 28.8
2000s 28.4
1990s 23.1
1980s 21.1
1970s 22.7
1960s 21.5
This is largely down to the decline in the draw. There have been more and more results in Tests and although the proportion of them that have gone the way of the visitors has shifted slightly in favour of the home team, this has resulted in a significant rise in away wins.
That said, there are other factors that suggest the balance of power is shifting slightly towards the home team. The gap between averages at home and averages away is growing, for example. So let's assume for now that the premise is true, and that home teams are increasingly dominant.
Holding and Ponting have suggested giving the toss to the visiting captain to prevent home teams stacking the conditions in their favour. I don't know whether this is a good idea or not. But there are three reasons that we should question whether it would achieve its aims.
Firstly, it assumes groundsmen can reliably bake certain characteristics into a pitch. In practice, pitch preparation seems to be an inexact science. I have stood before Test matches around the world and listened to groundsmen describe how the pitch is going to play, only to watch it do something completely different half an hour later.
It also presupposes that the interests of groundsman and home team are aligned, which is often not the case. In England for example, venues are heavily incentivised to maximise revenues from the Tests they host by ensuring five full days' play. So groundsmen, understandably, often pay less attention to the needs of the visiting circus than to the people who pay their salary for the other 51 weeks of the year.
Secondly, there is a law of unintended consequences in sporting rule changes that can often produce the opposite result to the one intended. If a home captain had control over the pitch, the framers of this law are assuming he would back away from tilting it in his favour. Is it not just as likely that he would go the other way and seek to produce a pitch so favourable that the toss was taken out of the equation? This after all is what MS Dhoni openly sought to do when England and Australia each last toured, produce pitches that turn big from ball one, and so take the toss out of the equation. Equally, you could imagine England or Australia producing genuine green-tops that would be as helpful to the quicks on day four as day one.
But lastly, and most importantly, it assumes that captains are able to use the toss to their advantage. This is not in any way proven. In fact the evidence suggests it just isn't the case.
At the time of writing, 1,048 Tests have been played since January 1990. During that period, the side that won the toss has lost slightly more (377) matches than it has won (374). Winning the toss in the modern era appears to give a side no advantage at all.
It wasn't always so. On uncovered pitches, batting first in almost all instances was a robustly successful strategy. If it rained during the match, the pitch would deteriorate, affecting the side batting second disproportionately. Until 1970, the side batting first in a Test won 36 per cent of matches, and lost 28 per cent.
But in the modern era, the advantage of winning the toss seems to have disappeared. This is, of course, stunningly counterintuitive. Test cricket is an asymmetric game. One team bats first, then the other. And the two teams' chances of winning are not equal. The team batting first has different requirements for victory to the team batting second, and the pitch changes over the course of the match, affecting the balance of power between bat and ball. Therefore, we would assume, teams that win the toss can choose the best conditions and so gain an advantage. But they don't. How can that possibly be?
Dropped catches and a sickening injury to Simon Jones didn't help Nasser Hussain after he chose to bowl in Brisbane in 2002 © Getty ImagesSometimes, a perfectly reasonable response to current circumstances becomes a habit, then a tradition, then an article of faith that outlives the circumstances that created it. We rarely question what we know to be self-evidently true. And so the bias towards batting first seems to have outlived the circumstances that created it by several decades.
"If you win the toss, nine times out of ten you should bat. On the tenth occasion you should think about bowling and then bat."
That was a very successful strategy to adopt for the first century of Test cricket. And one that is still the default setting for most captains. In the 700 Tests played since January 2000, nearly twice as many captains have batted first than have chosen to bowl. Is it still successful?
In a word, no. In that period, the side batting first has won 36 per cent of those Tests, the side bowling first 39 per cent. The bat-first bias at the toss would seem to be neutral at best, and probably counter-productive.
It is still hard to believe that captains aren't able to use the toss to their advantage. There are venues where the evidence is stark. Some pitches clearly favour the side batting first, some the side batting second. In the 40 Tests played in Lahore, the team batting first has won just three. Adelaide by contrast is a classic bat-first venue. It starts as a batsman's paradise, but by the fifth day can be very tricky to bat on, with considerable turn for the spinners. In the 74 Tests played at the ground the side batting first have won 35, the side batting second 19. Since 1990 averages in the first innings are 44.6, in the second 38.9, the third 30.1 and the fourth 27.1 and, as you would expect, in that period, 25 out of 26 captains have chosen to bat first, gaining a considerable advantage in doing so.
These are not isolated cases. Many pitches have similarly skewed characteristics. Galle and Old Trafford for example, both have similar records to Adelaide. Karachi is as bowl-first friendly as Lahore.
****
Captains' behaviour at the toss seems to be yet another example of received cricketing wisdom not concurring with the evidence. Where what teams do doesn't seem to maximise their chances of winning. Why is this the case?
Well, part of the story involves how our brains handle information. There has been a great deal of research into memory and perception, and the results are both surprising and illuminating when it comes to our decision-making in sport. For a start, our memories don't work as you might expect. They are not akin to a videotape; we don't record a series of events and then play them back as and when they are needed.
The disturbing truth is that our unaided recall is not very good. The human brain encodes less than 10 per cent of what we experience, the rest it simply makes up. Our minds construct a narrative around the coded memories we do have that fills in the gaps with a plausible story. Faced with a huge number of random or near random events (a cricket match, for instance) our brains pattern-spot, even when there is no pattern. Our minds look for those events that they can form into a pattern or story, and that becomes the meaning or lesson that we take away from the match. Even if the vast number of events that occurred didn't fit the pattern, we disproportionately remember the ones that did.
At their best then, our memories seem to work along the lines of Albert Camus's description of fiction, they are the lie through which we tell the truth. What we remember didn't actually happen, what we remember is a story that our brains have fabricated, but one that we hope contains the essential truth of what happened in a way that we can understand and retain.
Our fallible memories are only part of the reason captains and coaches behave the way they do. There is another, far more powerful reason to make the choices they make and one which is harder to argue against. For this we need to go back to Brisbane in 2002, and Nasser Hussain choosing to bowl.
"The test of a first-rate intelligence is the ability to hold two opposed ideas in the mind at the same time, and still retain the ability to function." - F. Scott Fitzgerald
It was the first Test of the Ashes, an Australian team were at the peak of their powers and playing at home in 'Fortress Brisbane', the hardest ground in the world to win at as an away team. No visiting team had won in the last 26 Tests played at the 'Gabbattoir'. Hussain won the toss and chose to bowl, Australia were 364-2 by the close of play and went on to win comfortably.
It is no use looking back with hindsight and using that to determine whether a decision was right or wrong. I am sure that if Nasser had known that choosing to bowl first would bring a host of dropped chances, the loss of a bowler to injury and Australia piling up the first-innings runs, he would have chosen to have a look behind door B and strapped his pads on.
But he didn't know, and in evaluating a past decision, we shouldn't know either. We need to remain behind the veil of ignorance, aware of all the potential paths the match could have taken, but ignorant of the one that it did.
One way we can do that is to simulate the match. There are various models that allow us to simulate matches given the playing strengths of the two sides and give probabilities for the outcome. When we do this for that Brisbane Test, we get the following probabilities for England:
Decision Win Draw Lose
Bat First 4% 3% 93%
Bowl First 4% 10% 86%
Every batsman in Australia's top seven for that match finished his career averaging over 45 (three averaged 50-plus), none of the English players did, only two averaged 40. England had a decent bowling attack. Australia had Warne, McGrath and Gillespie with 1,000 wickets between them already.
England were a pretty good side, they'd won four, lost two of their previous 10 matches. But they were hopelessly outgunned, and in alien conditions. Steve Waugh, the Australian captain, was also going to bowl if he had won the toss. If he had done then Australia would almost certainly have won the match as well. Australia were almost certainly going to win regardless of who did what at the toss.
But none of that made any difference. Hussain's decision to bowl first was castigated by the public and press of both countries. Wisden described it as "one of the costliest decisions in Test history". One senior journalist wrote that the decision should prompt the England captain "to summon his faithful hound, light a last cigarette and load a single bullet into the revolver".
For Nasser in Brisbane, read Ricky Ponting at Edgbaston in 2005, another decision to insert the opposition that has never been lived down. Yet, if either of them had batted first and lost, no one would ever remember their decision at the toss. You will rarely if ever be criticised for choosing to bat. Batting is the default setting; bowling first is seen as the gamble. And remember, the side that bats first loses significantly more than it wins.
Test cricket is one of the greatest contests in sport, a brilliant, multi-faceted contest for mind and body. But it is also a game of numbers. If you can tilt the numbers slightly in your favour, get them working for you, not against you, plot a slightly more efficient path to victory, then you are always working slightly downhill rather toiling against the slope.
As I write this, Pakistan are about to go out and bowl for the fourth consecutive day of England's first innings in Abu Dhabi on a pitch that you could land light aircraft on. They have home advantage, have made the orthodox decision, played well, and yet there is only one team that can win the match from here, and it isn't them. If this is what home advantage and winning the toss looks like then they are welcome to it.
It is all but certain that if they had ended up batting second they would now be in a considerably better position. Reverse the first innings as they have happened and Pakistan would now be batting past an exhausted England side and about to put them under the pump for a difficult last three sessions. And in the alternative scenarios where one side or the other got a first innings lead, as we have seen, those work disproportionately in favour of the side batting second.
But, we all do it. We look at a pristine wicket, flat, hard and true, and batting seems the only option. It is written into our cricketing DNA. The evidence may suggest there is a small marginal gain in bowling. But small margins be damned. If the marginal gain erodes your credibility and authority, then that is probably not an exchange you are willing to make. There are tides you can't swim against.
Which brings us back to Alastair Cook and Misbah-ul-Haq, standing in Abu Dhabi in the baking heat. Both are men of considerable character; brave, implacable and preternaturally determined to win. Each has withstood the slings and arrows of captaining their country through some fairly outrageous fortunes. Each is ready to bat first without a second thought. Because while they are certainly brave, they are not stupid. And you would have to be really stupid to make the right decision.
And there of course you have the central problem of much decision-making in cricket. This pitch is slightly different to all the other pitches that there have ever been. And you don't know for certain how it is going to play, or how that will influence the balance of power in the match. There are those who would argue that this is why stats are useless, or at best very limited.
I would agree entirely that stats are never sufficient to make a decision. There is nuance and subtlety to weigh; the brain and eye have access to information that the laptop doesn't. The feel and instincts of coaches and players, the hard-wired learning from decades in the game, contains incredibly valuable information and will always be the mainstay of decision-making that must be flexible and fluid through changing match situations. But if we are honest, we must also accept that the sheer weight and tonnage of what we don't know about how cricket works would sink a battleship. To use stats and nothing else to make decisions would be incredibly foolish, and as far as I am aware no one ever has. But equally, to insist on making decisions on incomplete information, without ever reviewing the effectiveness of those decisions would seem almost equally perverse.
I'm not saying that everyone was wrong in Abu Dhabi. I'm not saying that Misbah should have bowled. The weight of opprobrium heaped on him doesn't bear thinking about. It's the sort of decision that ends captaincies. No, Misbah had only one option and he took it. But maybe, just maybe, one day there will come a time when it isn't such an obvious choice.
Sunday, 22 November 2015
Why job interviews are pointless
Richard Nisbett in The Guardian

Hard taskmaster: Ricky Gervais as David Brent in The Office. Photograph: Adrian Rogers/BBC
Statistics often sounds like a dry subject, but many judgments and decisions in everyday life would be improved by an application of statistical principles. Take the following scenario: a football scout hears of a player who has powered his team to a good win-loss record. His coaches think he’s one of the most talented players they’ve seen. But the scout is unimpressed by the one practice game he sees him in; he tells his manager it’s not worth trying to recruit the player.
Statistics often sounds like a dry subject, but many judgments and decisions in everyday life would be improved by an application of statistical principles. Take the following scenario: a football scout hears of a player who has powered his team to a good win-loss record. His coaches think he’s one of the most talented players they’ve seen. But the scout is unimpressed by the one practice game he sees him in; he tells his manager it’s not worth trying to recruit the player.
Most sports fans would think that was a pretty foolish call, right? Athletic performance is much too variable to base an important judgment on such a small sample. It’s not necessary to take a statistics course to get the correct answer to this problem.
But consider this problem: an employer gets an application from a junior executive with an excellent college record and strong references from his current employer. The employer interviews the applicant and is unimpressed. The employer tells his colleagues that it’s not worthwhile recruiting him.
Most people regard this as a reasonable sort of decision. But it isn’t. Countless studies show that the unstructured 30-minute interview is virtually worthless as a predictor of long-term performance by any criteria that have been examined. You have only slightly more chance of choosing the better of two employees after a half-hour interview as you would by flipping a coin.
In both of these cases, predictions based on references – school reports, prior performance, letters of recommendation – give a 65-75% chance of choosing the better of the two.
Why do we get the athletic problem right and the employment problem wrong? Because in the case of the job, unlike for athletic performance, we haven’t seen hundreds of candidates in interviews of a particular type and seen how well performance in the interview corresponds to ultimate performance in the setting we’re concerned about. We haven’t seen that the guy who looks like a dunce in the interview turns out to be a whiz on the job and the guy who aced the interview turns out to be a dud. The only way to see that the interview isn’t going to be worth much is to be able to apply the “law of large numbers”, which prompts the recognition that an interview represents a very small sample of behaviour, whereas the references summarise a lot of behaviour.
The bottom line: there’s safety in numbers. The more recommendations a person has, the more positive the outcome is likely to be for the employer. Consider the job interview: it’s not only a tiny sample, it’s not even a sample of job behaviour but of something else entirely. Extroverts in general do better in interviews than introverts, but for many if not most jobs, extroversion is not what we’re looking for. Psychological theory and data show that we are incapable of treating the interview data as little more than unreliable gossip. It’s just too compelling that we’ve learned a lot from those 30 minutes.
My recommendation is not to interview at all unless you’re going to develop an interview protocol, with the help of a professional, which is based on careful analysis of what you are looking for in a job candidate. And then ask exactly the same questions of every candidate. It’s harder to develop such a protocol than you might guess. But it can really pay off.
Friday, 29 May 2015
Shoddy Science - Study showing that chocolate can help with weight loss was a trick
Posing as Johannes Bohannon, Ph.D, the research director of the fabricated Institute of Diet and Health, biologist and science journalist John Bohannon ran what he called a “fairly typical study” used in the field of diet research.
German broadcast journalists Peter Onneken and Diana Löbl asked Bohannon to conduct a clinical trial into the effects of dark chocolate, as part of a documentary exposing how simple it is for bad science to make headlines.
“It was terrible science. The results are meaningless, and the health claims that the media blasted out to millions of people around the world are utterly unfounded,” Bohannon wrote of his in an article for io9.com.
To collate their data, the team asked 5 men and 11 women aged between 19 to 67 to follow either a low-carbohydrate diet, or the same diet but with an added 1.5oz of dark chocolate. Meanwhile, a control group were asked to eat as normal.
While the data showed that the group which ate a low-carb diet while indulging in dark chocolate lost weight 10 per cent faster and had better cholesterol readings, Bohannon stressed that the study was set up for failure.
“Here’s a dirty little science secret: If you measure a large number of things about a small number of people, you are almost guaranteed to get a “statistically significant” result.”Bohannon explained that thanks to a method known as "p-hacking", the study could have just as likely shown that chocolate helped sleep or lowered blood pressure as the threshold for data being classed as "significant" is just 0.05 per cent.
") THE STUDY COULD HAVE JUST AS LIKELY SHOWN A POSITIVE EFFECT ON BLOOD PRESSURE THAN WEIGHT LOSS, SAYS BOHANNON (PHOTO: GETTY IMAGES)
THE STUDY COULD HAVE JUST AS LIKELY SHOWN A POSITIVE EFFECT ON BLOOD PRESSURE THAN WEIGHT LOSS, SAYS BOHANNON (PHOTO: GETTY IMAGES)
After a journal was duped into accepting the shoddy study for money, Bohannon and his colleagues then put together a press release which would be irresistible to journalists and editors looking for a story.
The research was splashed across newspapers and websites across 20 countries in half a dozen languages, seemingly proving how easily dodgy science can circulate across the world’s media.
However, some have questioned the ethic behind the study, with one commenter writing below the piece:
"Going out of their way to court media coverage (that was going to repeat the story but never, ever follow up on the hoax once it was revealed — and this is a hoax) was ethically problematic,” one commenter said.
"If you want to uncover the shady workings, that didn’t really help. It seems like only the people who were already aware of the problems are going to be reached by this reveal."
The stunt came after Bohannon exposed how “open access”science journals were willing to publish deeply flawed research claiming that a drug had anti-cancer properties.
In the investigation for the prestigious journal Science, he revealed the dangers of abandoning the peer-review process expected in science publishing.
Wednesday, 1 April 2015
CAG rips into famed Gujarat growth model
TNN | Apr 1, 2015, 01.00 AM IST
The Comptroller & Auditor General (CAG) of India report tabled in the state assembly on Tuesday raised several question marks on the much-famed Gujarat Model.
The report tore apart the tall claims of the state government led by former chief minister Narendra Modi on agricultural growth, social indicators and spent on social infrastructure, fiscal discipline, right to education, and law and order situation.
The report observed that Gujarat's average annual agriculture growth rate during the 11th five-year plan (2007-12) was 5.49% — better than the all India average of 4.06%. However, GDP in agriculture clocked a negative growth (-6.96%) in 2012-13, the first year of 12th plan, as compared to the previous years — 21.64% in 2010-11 and 5.02% in 2011-12.
Failure in social sector schemes like State Child Protection Policy is also highlighted. The report notes that as per 2011 census, while the all-India sex ratio improved from 933 to 943, it worsened from 922 to 919 in Gujarat. The state hasn't performed well in implementing the Pre-Conception and Pre-Natal Diagnostic Techniques Act, only six out of total 181 offenders were convicted.
Also highlighted are the government's failure in preventing child marriages, poor implementation of the Right to Education Act, delay in road projects and failure in the execution of mid-day meal scheme, besides taking note of poor pupil-teacher ratio, and poor implementation of water supply scheme among others.
The CAG has also slammed the Gujarat government for the high level of financial indiscipline and poor spending. "The fiscal deficit increased from Rs 15,513 crore in 2009-10 to Rs 18,422 crore in 2013-14." It also highlighted non-submission of utilization certificates of Rs 7420.40 crore indicating lack of proper monitoring by departments. CAG observed lapses in tax collection also. It noted that more than Rs 300 crore non-recovery of Value Added Tax (VAT).
Public sector undertakings, too, posted an unimpressive return on investment according to the report. "During the last five years, the state government invested Rs 24,007 crore, the average return by way of dividend on the investments in government companies and statutory corporations etc., was 0.31% only," the report noted.
Monday, 16 March 2015
Data is not the enemy
Ed Smith in Cricinfo
Taking the stats at your disposal into account does not mean your players cannot play a fearless and instinctive brand of cricket
 The information is available to the players. It's their choice whether to use it or not © AFP
Poor Peter Moores couldn't have chosen a sentence more likely to turn him into a human dartboard. He needed to "look at the match data," Moores said after England's disastrous defeat to Bangladesh. To a press corps increasingly convinced that the England team has become formulaic and nerdy, this was the worst answer Moores could have reeled off.
It did, however, open up a whole new range of possibilities for the post-match interview. One wondered how historic sports interviews might have been different in the age of referencing match data.
Interviewer to George Foreman after he lost to Muhammad Ali in 1974: "What did you make of the fight, George?"
Foreman: "Haven't seen the fight data yet."
Interviewer: "Well, two men were standing up at the start of the eighth. Then there was one. You were on the canvas. In an algorithm: 2; 8; 1."
Foreman: "Right, got it."
And how would a data-inspired interview have run after the 1978 Oxford-Cambridge boat race, when Cambridge sank into the Thames, live on television?
Interviewer to Cambridge captain: "Disappointing race out there, I imagine?"
Captain: "Impossible to say before seeing the race data."
Interviewer: "Glug, glug, glug - ring any bells?"
All this mischief, however, does not explain very much why England crashed out of the World Cup. Are we really to believe that the central figure in the catastrophe was Nathan Leamon, the mathematician and former schoolteacher who is now England's stats analyst? That is ridiculous. It is Leamon's job to supply evidence that may help the management to make better decisions. It is the job of the coaching staff to use that information appropriately. So even if you believe, as I do, that England need to play a more fearless, instinctive brand of cricket, it does not follow that having access to potentially useful data prevents you from doing so.
The real problem is not maths, which by definition is flinty, pitiless, robust and unsentimental. No, the problem is management-speak, learned jargon and corporate-style snake oil. The unfortunate thing is that coaches can now use the phrase "match data" as just another thing to say when they are avoiding the subject. It slots into the lexicon of cliché, alongside "taking the positives", "skill sets" and "plan execution".
The irony is that real maths, in fact, is at the opposite end of the spectrum from jargon. Maths is exclusively content; jargon is content-free.
In his 1946 essay "Politics and the English Language", George Orwell despaired of political jargon: "As soon as certain topics are raised, the concrete melts into the abstract and no one seems able to think of turns of words that are not hackneyed: prose consists less and less of words chosen for the sake of meaning, and more and more of phrases tacked together like the sections of a prefabricated hen-house." Sport soon surpassed politics for meaningless waffle. Orwell deserves a new epitaph: "The man who foresaw the evolution of the post-match interview."
The former England captain Mike Atherton made several good points about the rush to blame data for all England's woes. First, analytics now has less influence over the team than it did in the more successful Flower-Strauss era. Secondly, Leamon's work is not pushed down players' throats. Stats for the particular ground, videos of an opposition bowler's range of slower balls, these things are available if players want to see them. If they don't, fine.
 Nathan Leamon has a gift for numbers but he doesn't believe they provide all the answers © PA Photos
In 2006, while I was writing my book What Sport Tells Us About Life, I dedicated a whole chapter to the remarkable success of a school rugby team, unbeaten for three seasons, a sequence of 33 games. From the author's perspective, drawing lessons from a school coach was an unusual and risky approach. After all, other subjects of my book included Zinedine Zidane, Billy Beane and Michael Jordan. What was a school coach doing in that company?
The answer is that I thought his methodology was worth bringing to a wider audience. The coach was a plain-speaking, no-nonsense Lancastrian who pared down his comments to players. Rather than talking for talking's sake - as most coaches do - he researched what really happened in the matches and fed back small chunks of highly useful information. The quest was to find insight, concision and meaning; and to avoid noise, chatter and cliché.
Who was this progressive but unheard-of coach? Nathan Leamon. His approach, then and now, is thoughtful, flexible and open. His character is modest without being deferential, self-contained without being standoffish. Now, nine years on, he must find the way he is portrayed in the media as unrecognisable. Far from being a credulous geek, Leamon is an understated sceptic, a sensible and balanced man who happens to have a gift for numbers. Leamon is the last person to argue that data can provide all the answers - he's much too smart.
While England were exiting the World Cup, the retired NBA player Shane Battier was addressing a sold-out audience at the MIT Sloan Sports Analytics Conference in Boston. If you want to understand how data can help a sportsman perform better, read Michael Lewis on Battier's playing days.
Or this, exploring why it is so hard, with the naked eye, to understand the way that Mesut Özil, the Arsenal footballer, creates space on a football pitch.
Like it or not, as professional sport evolves it will provide greater scope for academic rigour. A lot of clever people like sport and they are constantly developing ideas - some good, others less good - that may eventually become absorbed into the mainstream. Bill James' understanding of data changed baseball forever. Eventually no coach could afford to ignore James' ideas because it would cost them games.
That is why the status of the sports analyst is going up. Nate Silver, who has become the most important analyst of American presidential elections, cut his teeth modelling sports matches. Ideas that originate in sport are finding wider application in the outside world.
And yet I am equally confident that a central task for sports coaches - now more than ever - is to liberate players, to free them from stifling anxiety and fearfulness.
Those two truths exist in parallel, not in conflict. Coaches will inevitably want to use every tool at their disposal, including relevant data. Then they must have the psychological nous, the feel and the common touch, to allow players to express themselves.
 In the future of limited-overs cricket, can batsmen build dominant positions early enough to reduce the risk of getting out so much as to take it out of the equation? size: 900 © Getty Images
In the end, the discussion of data in sport tends to reveal more about prejudices than the underlying reality. It's all too easy to blame other people for using either too much or too little evidence en route to their decisions. I am intuitive, you are strangely convinced, he is delusional. Or, if you prefer, I am rational, you are a reductionist, he is a slave to numbers.
There is another story to emerge from this World Cup. The central innovation, which has now transferred from T20 to ODIs, is that talented batsmen are lethal - perhaps unstoppable - when they play without any fear of getting out. In 2003 I played in the first ever T20 league. I wrote at the time that it allowed players to play as they do in the nets, when they are totally uninhibited.
This powerful freedom, however, is partly earned by the match situation, especially in the middle overs. If the batting team is behind in the match, and there are few wickets in hand, it is far harder to bat as though another wicket wouldn't matter. The challenge now, in all white-ball cricket, is to build a position so dominant that there is no risk attached to getting out. If you are batting at 360 for 2 with seven overs left - with, say, Glenn Maxwell padded up and waiting - there is literally no risk in trying to hit a six and getting out. Paradoxically, of course, that makes you more likely to hit the ball for six!
Perhaps someone can show me the data on how quickly this underlying dominance turns into an impregnable lead. If I was coach, I'd certainly want to know.
Taking the stats at your disposal into account does not mean your players cannot play a fearless and instinctive brand of cricket
The information is available to the players. It's their choice whether to use it or not © AFPPoor Peter Moores couldn't have chosen a sentence more likely to turn him into a human dartboard. He needed to "look at the match data," Moores said after England's disastrous defeat to Bangladesh. To a press corps increasingly convinced that the England team has become formulaic and nerdy, this was the worst answer Moores could have reeled off.
It did, however, open up a whole new range of possibilities for the post-match interview. One wondered how historic sports interviews might have been different in the age of referencing match data.
Interviewer to George Foreman after he lost to Muhammad Ali in 1974: "What did you make of the fight, George?"
Foreman: "Haven't seen the fight data yet."
Interviewer: "Well, two men were standing up at the start of the eighth. Then there was one. You were on the canvas. In an algorithm: 2; 8; 1."
Foreman: "Right, got it."
And how would a data-inspired interview have run after the 1978 Oxford-Cambridge boat race, when Cambridge sank into the Thames, live on television?
Interviewer to Cambridge captain: "Disappointing race out there, I imagine?"
Captain: "Impossible to say before seeing the race data."
Interviewer: "Glug, glug, glug - ring any bells?"
All this mischief, however, does not explain very much why England crashed out of the World Cup. Are we really to believe that the central figure in the catastrophe was Nathan Leamon, the mathematician and former schoolteacher who is now England's stats analyst? That is ridiculous. It is Leamon's job to supply evidence that may help the management to make better decisions. It is the job of the coaching staff to use that information appropriately. So even if you believe, as I do, that England need to play a more fearless, instinctive brand of cricket, it does not follow that having access to potentially useful data prevents you from doing so.
The real problem is not maths, which by definition is flinty, pitiless, robust and unsentimental. No, the problem is management-speak, learned jargon and corporate-style snake oil. The unfortunate thing is that coaches can now use the phrase "match data" as just another thing to say when they are avoiding the subject. It slots into the lexicon of cliché, alongside "taking the positives", "skill sets" and "plan execution".
The irony is that real maths, in fact, is at the opposite end of the spectrum from jargon. Maths is exclusively content; jargon is content-free.
In his 1946 essay "Politics and the English Language", George Orwell despaired of political jargon: "As soon as certain topics are raised, the concrete melts into the abstract and no one seems able to think of turns of words that are not hackneyed: prose consists less and less of words chosen for the sake of meaning, and more and more of phrases tacked together like the sections of a prefabricated hen-house." Sport soon surpassed politics for meaningless waffle. Orwell deserves a new epitaph: "The man who foresaw the evolution of the post-match interview."
The former England captain Mike Atherton made several good points about the rush to blame data for all England's woes. First, analytics now has less influence over the team than it did in the more successful Flower-Strauss era. Secondly, Leamon's work is not pushed down players' throats. Stats for the particular ground, videos of an opposition bowler's range of slower balls, these things are available if players want to see them. If they don't, fine.
Nathan Leamon has a gift for numbers but he doesn't believe they provide all the answers © PA PhotosIn 2006, while I was writing my book What Sport Tells Us About Life, I dedicated a whole chapter to the remarkable success of a school rugby team, unbeaten for three seasons, a sequence of 33 games. From the author's perspective, drawing lessons from a school coach was an unusual and risky approach. After all, other subjects of my book included Zinedine Zidane, Billy Beane and Michael Jordan. What was a school coach doing in that company?
The answer is that I thought his methodology was worth bringing to a wider audience. The coach was a plain-speaking, no-nonsense Lancastrian who pared down his comments to players. Rather than talking for talking's sake - as most coaches do - he researched what really happened in the matches and fed back small chunks of highly useful information. The quest was to find insight, concision and meaning; and to avoid noise, chatter and cliché.
Who was this progressive but unheard-of coach? Nathan Leamon. His approach, then and now, is thoughtful, flexible and open. His character is modest without being deferential, self-contained without being standoffish. Now, nine years on, he must find the way he is portrayed in the media as unrecognisable. Far from being a credulous geek, Leamon is an understated sceptic, a sensible and balanced man who happens to have a gift for numbers. Leamon is the last person to argue that data can provide all the answers - he's much too smart.
While England were exiting the World Cup, the retired NBA player Shane Battier was addressing a sold-out audience at the MIT Sloan Sports Analytics Conference in Boston. If you want to understand how data can help a sportsman perform better, read Michael Lewis on Battier's playing days.
Or this, exploring why it is so hard, with the naked eye, to understand the way that Mesut Özil, the Arsenal footballer, creates space on a football pitch.
Like it or not, as professional sport evolves it will provide greater scope for academic rigour. A lot of clever people like sport and they are constantly developing ideas - some good, others less good - that may eventually become absorbed into the mainstream. Bill James' understanding of data changed baseball forever. Eventually no coach could afford to ignore James' ideas because it would cost them games.
That is why the status of the sports analyst is going up. Nate Silver, who has become the most important analyst of American presidential elections, cut his teeth modelling sports matches. Ideas that originate in sport are finding wider application in the outside world.
And yet I am equally confident that a central task for sports coaches - now more than ever - is to liberate players, to free them from stifling anxiety and fearfulness.
Those two truths exist in parallel, not in conflict. Coaches will inevitably want to use every tool at their disposal, including relevant data. Then they must have the psychological nous, the feel and the common touch, to allow players to express themselves.
In the future of limited-overs cricket, can batsmen build dominant positions early enough to reduce the risk of getting out so much as to take it out of the equation? size: 900 © Getty ImagesIn the end, the discussion of data in sport tends to reveal more about prejudices than the underlying reality. It's all too easy to blame other people for using either too much or too little evidence en route to their decisions. I am intuitive, you are strangely convinced, he is delusional. Or, if you prefer, I am rational, you are a reductionist, he is a slave to numbers.
There is another story to emerge from this World Cup. The central innovation, which has now transferred from T20 to ODIs, is that talented batsmen are lethal - perhaps unstoppable - when they play without any fear of getting out. In 2003 I played in the first ever T20 league. I wrote at the time that it allowed players to play as they do in the nets, when they are totally uninhibited.
This powerful freedom, however, is partly earned by the match situation, especially in the middle overs. If the batting team is behind in the match, and there are few wickets in hand, it is far harder to bat as though another wicket wouldn't matter. The challenge now, in all white-ball cricket, is to build a position so dominant that there is no risk attached to getting out. If you are batting at 360 for 2 with seven overs left - with, say, Glenn Maxwell padded up and waiting - there is literally no risk in trying to hit a six and getting out. Paradoxically, of course, that makes you more likely to hit the ball for six!
Perhaps someone can show me the data on how quickly this underlying dominance turns into an impregnable lead. If I was coach, I'd certainly want to know.
Wednesday, 4 March 2015
Cricket’s great data debate: art v science
Andy Bull in The Guardian
In July 2007, after a history reckoned to stretch back almost 4,000 years, the game of draughts was finally solved. After two decades of work, a team of computer scientists at the University of Alberta finished sifting through the 500 billion, billion possible positions on the board. Their computer programme, Chinook, was now unbeatable. So long as neither player made a mistake, every game it played was guaranteed to end in a stalemate. Later that same summer, Peter Moores was appointed as head coach of the England cricket team. Moores was one of the new breed of coaches. A numbers man, and disciple of Michael Lewis’s much abused book, Moneyball. He even gave a copy to his batting coach, Andy Flower. Moores was so keen on advanced computer analysis that he used it as the sole basis for some of his decisions – the decision to recall Ryan Sidebottom to the side, for instance.
When Flower took over the team, he hired Nathan Leamon, a qualified coach and a former maths teacher, as the team’s analyst. The players nicknamed Leamon “Numbers”. He was extraordinarily meticulous. He used Hawk-Eye to draw up spreadsheets of every single ball delivered in Test cricket in the preceding five years. He ran match simulations – accurate to within 5% – to help England determine their strategies and their team selections. For the bowlers, he broke the pitch down into 20 blocks, each of them 100cm by 15cm, and told them which ones they should hit to best exploit the weaknesses Hawk-Eye had revealed in the opposing batsmen. Bowlers should aim to hit that particular block at least twice an over. Do that, Leamon told them, and they would “markedly increases the chance of success”.
England, it was said, were making better use of the computer analysis than any other team in the world. And it was working. They won the World T20, the Ashes home and away, and became, for a time, the No1 team in all three formats of the game. Leamon’s work was picked out as one of the reasons why. And yet now they’re losing, that very same approach is being singled out as one of the things they are doing wrong. You can see why. After England’s nine-wicket defeat to Sri Lanka, Eoin Morgan said “Going in at the halfway I think we got 310, probably 25 for both par, and again, stats back that up, par is 275, 280.” It was, Morgan thought, the bowlers who were to blame for the loss. They had delivered too many bad balls. He said he didn’t yet know why. “Over the next couple of days, we will get the Hawk-Eye stuff back and the proof will be in that.”
On Tuesday morning, Kevin Pietersen tweeted that England “are “too interested in stats”. He was echoing Graeme Swann’s comments from last summer. “I’ve sat in these meetings for the last five years,” Swann said. “It was a statistics-based game. There was this crazy stat where if we get 239 – this was before the fielding restrictions changed a bit so it would be more now, I assume – we will win 72% of matches. The whole game was built upon having this many runs after this many overs, this many partnerships, doing this in the middle, working at 4.5 an over.” Swann said he was left shaking his head.
Two respected players, both speaking from fresh first-hand experience, agree that England have become too reliant on computer analysis to tell them what to do. But balance that against the irritation old pros in all sports feel about big data. Just last week the great blowhard of the NBA Charles Barkley unleashed this tirade: “All these guys who run organisations who talk about analytics, they all have one thing in common – they’re a bunch of guys who have never played the game, and they never got the girls in high school, and they just want to get in the game.” Analytics, Barkley added, were “just some crap that some people who were really smart made up to try and get in the game”.
Barkley was shot down in flames. As Bryan Curtis summed it up in his wrap over on Grantland, commentators argued that Barkley’s rant was “unintelligible” and “wholly useless”, that he was a “dinosaur” who “didn’t even realise that the war is over”, and that “the nerds make the decisions”. In England though, where we’ve been slower to adopt analytics, the consensus seems to be that Swann and Pietersen are on to something. England’s over-reliance on the numbers has become a theme in the coverage of the team, particularly among ex-players. You can hear it when they bemoan, among other things, England’s reluctance to bowl yorkers at the stumps. That’s a tactic that has worked for years, one that has been honed by hard experience. But England’s analysis has told them that slow bouncers and full balls sent wide of off-stump are harder to score off.
The thing is, in an age when all teams are using computer analysis, a tactic isn’t good or bad because it looks that way, or because it is different to what has been done before. It is simply good if it works and bad if it doesn’t. The received wisdom is being challenged, and that’s a good thing. At the same time, cricket isn’t checkers. It can’t be solved by computer. It’s not a question of intuition versus analysis, or art v science, as David Hopps put it in a recent piece on Cricinfo. The laptop is just another tool in the box, useless unless the players understand the value of the information it provides, and no more valuable than their own ability to adapt and improvise during a match. If Swann and Pietersen are right, then England are wrong. At the same time, the lessons Leamon taught the team undoubtedly played a valuable part in their earlier success, something the sceptics seem to have forgotten.
Friday, 21 November 2014
GDP is a mirror on the markets. It must not rule our lives
By fixating on a snapshot of statistics, we focus on short-termism and lose sight of what the Victorians prized most: value


Next month the Office for National Statistics will issue data for the first time on the UK’s wellbeing. In the exercise, the ONS is recognising that GDP, which now includes estimates for the market value of illegal drugs and prostitution, is at best only a partial measure of our economic health. Not that one would draw this conclusion from the political tub-thumping that improved GDP figures bring.
GDP is a measure of economic activity in the market and in the moment. So its key shortcoming is that it collapses time and makes us short-term in focus. It counts investment and consumption in the same way – an extra £100 spent on education is equivalent to the same amount spent on fizzy drinks.
-----Also read
-----Also read
Economic Growth: the destructive god that can never be appeased
-----
Studies have repeatedly shown that the time horizon of the financial markets in particular is ever more short-term. Shaving about 0.006 seconds off the time it takes computer orders to travel from Chicago to the New Jersey data centre which houses the Nasdaq servers made it worth investing several hundred million dollars in tunnelling through a mountain range to lay the fibre optic cable in a straighter line. More than two-thirds of trades in US equity markets are high-frequency automated orders. How has the search for profit so foreshortened our vision?
It wasn’t always so. The term “Victorian values” now speaks to us of characteristics such as narrow-mindedness, hypocrisy and conformity, but it could also speak of hard work, self-improvement and above all self-sacrifice for the future. The list of the Victorians’ investments in our future is staggering. It includes railways, canals, sewers and roads; town halls and libraries, schools and concert halls, monuments and museums, modern hospitals and the profession of nursing; learned societies, the police, trades unions, mutual insurers and building societies – organisations that have often survived more than a century.
Why the Victorians managed to be so visionary is not entirely clear, but it had something to do with the confidence of an age of discovery both in science and other areas of knowledge, and also in geographical exploration and empire building. They made such strides against ignorance and the unknown, firm in their sense of divine approbation, it seems a belief in progress came naturally to them.
Civic and business leaders in the late 19th century had extraordinary confidence and far-sightedness, even as they too stood at the centre of social and economic upheaval. This Victorian sense of stewardship is something we could usefully remind ourselves of when thinking about how we measure value today. In the late 19th century it was the innovators and the builders of institutions who had standing, and it was the men and women of vision who were understood to be the creators of value.
They still are, even if it is often hard to measure or quantify what they build. Anything of value has its roots in values and vision, as much today as at any time in the past.
Financial markets have their place as a powerful way of harnessing incentives to achieve desirable outcomes. For example, the market in the US for trading permissions to emit sulphur dioxide, which helps cause acid rain, has been a triumphant success in removing what was once a serious environmental harm.
However, there is no sign that the wider public has stopped challenging the ascendancy of markets and money. The bestseller status of Thomas Piketty’s Capital in the 21st Century bears witness to that. It has put the question of the great inequality of wealth in the market economies at the centre of public debate, and it underlines another question: what is the point of economic growth if it does not make most people better off? Or, worse, if growth is actually destroying things that many of us value.
A further problem with GDP is that it obviously includes many things that are value-destroying. Natural disasters are good for GDP growth because of the reconstruction boom afterwards; the destruction of assets and human life is not counted. The metric ignores the depletion of resources, the loss of biodiversity, the impact of congestion, and the loss of social connection in the modern market economy.
People have long proposed alternative measures of progress – recently, environment-adjusted measures, or simply measuring happiness, directly by survey. What could be more straightforward than asking such a direct question? But reported happiness changes very little over time because, whether it’s the joy of a lottery win or the catastrophe of being disabled in an accident, it only takes about two years for people experiencing even a dramatic change in their life to revert to previous levels of happiness.
This takes us back to monetary measures, back to GDP and its inclusion of things that clearly have negative value. It also excludes “informal” activities such as housework and caring, many volunteer activities, and always excludes the full value of innovations. Nathan Mayer Rothschild was the richest man in the world at the time of his death from an infected tooth abscess in 1836. An antibiotic that hadn’t then been invented but now costs just $10 would have saved him. How much would he have paid for that medicine?
Subscribe to:
Posts (Atom)