
Boris Johnson did not remove the £350m figure from the Leave campaign bus even after it had been described as ‘misleading’. Photograph: Stefan Rousseau/PA
David Spiegelhalter in The Guardian
I love numbers. They allow us to get a sense of magnitude, to measure change, to put claims in context. But despite their bold and confident exterior, numbers are delicate things and that’s why it upsets me when they are abused. And since there’s been a fair amount of number abuse going on recently, it seems a good time to have a look at the classic ways in which politicians and spin doctors meddle with statistics.
Every statistician is familiar with the tedious “Lies, damned lies, and statistics” gibe, but the economist, writer and presenter of Radio 4’s More or Less, Tim Harford, has identified the habit of some politicians as not so much lying – to lie means having some knowledge of the truth – as “bullshitting”: a carefree disregard of whether the number is appropriate or not.
So here, with some help from the UK fact-checking organisation Full Fact, is a nine-point guide to what’s really going on.
Use a real number, but change its meaning
There’s almost always some basis for numbers that get quoted, but it’s often rather different from what is claimed. Take, for example, the famous £350m, as in the “We send the EU £350m a week” claim plastered over the big red Brexit campaign bus. This is a true National Statistic (see Table 9.9 of the ONS Pink Book 2015), but, in the words of Sir Andrew Dilnot, chair of the UK Statistics Authority watchdog, it “is not an amount of money that the UK pays to the EU”. In fact, the UK’s net contribution is more like £250m a week when Britain’s rebate is taken into account – and much of that is returned in the form of agricultural subsidies and grants to poorer UK regions, reducing the figure to £136m. Sir Andrew expressed disappointment that this “misleading” claim was being made by Brexit campaigners but this ticking-off still did not get the bus repainted.

George Osborne quoted the Treasury’s projection of £4,300 as the cost per household of leaving the EU. Photograph: Matt Cardy/Getty Images
Make the number look big (but not too big)
Why did the Leave campaign frame the amount of money as “£350m per week”, rather than the equivalent “£19bn a year”? They probably realised that, once numbers get large, say above 10m, they all start seeming the same – all those extra zeros have diminishing emotional impact. Billions, schmillions, it’s just a Big Number.
Of course they could have gone the other way and said “£50m a day”, but then people might have realised that this is equivalent to around a packet of crisps each, which does not sound so impressive.
George Osborne, on the other hand, preferred to quote the Treasury’s projection of the potential cost of leaving the EU as £4,300 per household per year, rather than as the equivalent £120bn for the whole country. Presumably he was trying to make the numbers seem relevant, but perhaps he would have been better off framing the projected cost as “£2.5bn a week” so as to provide a direct comparison with the Leave campaign’s £350m. It probably would not have made any difference: the weighty 200-page Treasury report is on course to become a classic example of ignored statistics.

Recent studies confirmed higher death rates at weekends, but showed no relationship to weekend staffing levels. Photograph: Peter Byrne/PA
Casually imply causation from correlation
In July 2015 Jeremy Hunt said: “Around 6,000 people lose their lives every year because we do not have a proper seven-day service in hospitals….” and by February 2016 this had increased to “11,000 excess deaths because we do not staff our hospitals properly at weekends”. These categorical claims that weekend staffing was responsible for increased weekend death rates were widely criticised at the time, particularly by the people who had done the actual research. Recent studies have confirmed higher death rates at weekends, but these showed no relationship to weekend staffing levels.
Choose your definitions carefully
On 17 December 2014, Tom Blenkinsop MP said, “Today, there are 2,500 fewer nurses in our NHS than in May 2010”, while on the same day David Cameron claimed “Today, actually, there are new figures out on the NHS… there are 3,000 more nurses under this government.” Surely one must be wrong?
But Mr Blenkinsop compared the number of people working as nurses between September 2010 and September 2014, while Cameron used the full-time-equivalent number of nurses, health visitors and midwives between the start of the government in May 2010 and September 2014. So they were both, in their own particular way, right.
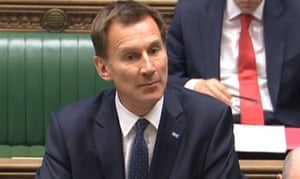
‘Indicator hopper’: Health secretary Jeremy Hunt. Photograph: PA
Use total numbers rather than proportions (or whichever way suits your argument)
In the final three months of 2014, less than 93% of attendances at Accident and Emergency units were seen within four hours, the lowest proportion for 10 years. And yet Jeremy Hunt managed to tweet that “More patients than ever being seen in less than four hours”. Which, strictly speaking, was correct, but only because more people were attending A&E than ever before. Similarly, when it comes to employment, an increasing population means that the number of employed can go up even when the employment rate goes down. Full Fact has shown how the political parties play “indicator hop”, picking whichever measure currently supports their argument.
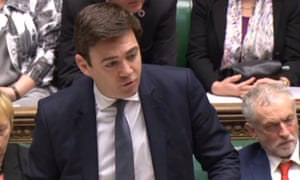
Is crime going up or down? Don’t ask Andy Burnham. Photograph: PA
Don’t provide any relevant context
Last September shadow home secretary Andy Burnham declared that “crime is going up”, and when pressed pointed to the police recording more violent and sexual offences than the previous year. But police-recorded crime data were de-designated as “official” statistics by the UK Statistics Authority in 2014 as they were so unreliable: they depend strongly on what the public choose to report, and how the police choose to record it.
Instead the Crime Survey for England and Wales is the official source of data, as it records crimes that are not reported to the police. And the Crime Survey shows a steady reduction in crime for more than 20 years, and no evidence of an increase in violent and sexual offences last year.
Exaggerate the importance of a possibly illusory change
Next time you hear a politician boasting that unemployment has dropped by 30,000 over the previous quarter, just remember that this is an estimate based on a survey. And that estimate has a margin of error of +/- 80,000, meaning that unemployment may well have gone down, but it may have gone up – the best we can say is that it hasn’t changed very much, but that hardly makes a speech. And to be fair, the politician probably has no idea that this is an estimate and not a head count.
Serious youth crime has actually declined, but that’s not because of TKAP. Photograph: Action Press / Rex Features
Prematurely announce the success of a policy initiative using unofficial selected data
In June 2008, just a year after the start of the Tackling Knives Action Programme (TKAP), No 10 got the Home Office to issue a press release saying “the number of teenagers admitted to hospital for knife or sharp instrument wounding in nine… police force areas fell by 27% according to new figures published today”. But this used unchecked unofficial data, and was against the explicit advice of official statisticians. They got publicity, but also a serious telling-off from the UK Statistics Authority which accused No 10 of making an announcement that was “corrosive of public trust in official statistics”. The final conclusion about the TKAP was that serious youth violence had declined in the country, but no more in TKAP areas than elsewhere.

Donald Trump: ‘Am I going to check every statistic?’
Photograph: Robert F. Bukaty/AP
If all else fails, just make the numbers up
Last November, Donald Trump tweeted a recycled image that included the claim that “Whites killed by blacks – 81%”, citing “Crime Statistics Bureau – San Francisco”. The US fact-checking site Politifact identified this as completely fabricated – the “Bureau” did not exist, and the true figure is around 15%. When confronted with this, Trump shrugged and said, “Am I going to check every statistic?”
Not all politicians are so cavalier with statistics, and of course it’s completely reasonable for them to appeal to our feelings and values. But there are some serial offenders who conscript innocent numbers, purely to provide rhetorical flourish to their arguments.
We deserve to have statistical evidence presented in a fair and balanced way, and it’s only by public scrutiny and exposure that anything will ever change. There are noble efforts to dam the flood of naughty numbers. The BBC’s More or Less team take apart dodgy data, organisations such as Full Fact and Channel 4’s FactCheck expose flagrant abuses, the UK Statistics Authority write admonishing letters. The Royal Statistical Society offers statistical training for MPs, and the House of Commons library publishes a Statistical Literacy Guide: how to spot spin and inappropriate use of statistics.
They are all doing great work, but the shabby statistics keep on coming. Maybe these nine points can provide a checklist, or even the basis for a competition – how many points can your favourite minister score? In my angrier moments I feel that number abuse should be made a criminal offence. But that’s a law unlikely to be passed by politicians.
David Spiegelhalter is the Winton Professor of the Public Understanding of Risk at the University of Cambridge and president elect of the Royal Statistical Society
No comments:
Post a Comment