Showing posts with label economic. Show all posts
Showing posts with label economic. Show all posts
Tuesday 20 February 2024
Tuesday 16 January 2024
The Economist examines India's Economic Performance
From The Economist
In the second week of 2024 business leaders descended on Gujarat, the home state of Narendra Modi, India’s prime minister. The occasion was the Vibrant Gujarat Global Summit, one of many gabfests at which India has courted global investors. “At a time when the world is surrounded by many uncertainties, India has emerged as a new ray of hope,” boasted Mr Modi at the event.
He is right. Although global growth is expected to slow from 2.6% last year to 2.4% in 2024, India appears to be booming. Its economy grew by 7.6% in the 12 months to the third quarter of 2023, beating nearly every forecast. Most economists expect an annual growth rate of 6% or more for the rest of this decade. Investors are seized by optimism.
The timing is good for Mr Modi. In April some 900m Indians will be eligible to vote in the largest election in world history. A big reason Mr Modi, who has been in office since 2014, is likely to win a third term is that many Indians think him a more competent manager of the world’s fifth-largest economy than they do any other candidate. Are they right?
To assess Mr Modi’s record The Economist has analysed India’s economic performance and the success of his biggest reforms. In many respects the picture is muddy—and not helped by sparse and poorly kept official data. Growth has outpaced that of most emerging economies, but India’s labour market remains weak and private-sector investment has disappointed. But that may be changing. Aided by Mr Modi’s reforms, India may be on the cusp of an investment boom that would pay off for years.
The headline growth figures reveal surprisingly little. India’s gdp per person, after adjusting for purchasing power, has grown at an average pace of 4.3% per year during Mr Modi’s decade in power. That is lower than the 6.2% achieved under Manmohan Singh, his predecessor, who also served for ten years.

But this slowdown was not Mr Modi’s doing: much of it is down to the bad hand he inherited. In the 2010s an infrastructure boom started to go sour. India faced what Arvind Subramanian, later a government adviser, has called a twin balance-sheet crisis, one that struck both banks and infrastructure firms. They were left loaded with bad debt, crimping investment for years afterwards. Mr Modi also took office at a time when global growth had slowed, scarred by the financial crisis of 2007-09. Then came the covid-19 pandemic. The difficult conditions meant average growth among 20 other large lower- and middle-income economies fell from 3.2% during Mr Singh’s time in office to 1.6% during Mr Modi’s. Compared with this group, India has continued to outperform (see chart 1).
Against such a turbulent backdrop, it is better to assess Mr Modi’s record by considering his stated economic objectives: to formalise the economy, improve the ease of doing business and boost manufacturing. On the first two, he has made progress. On the third, his results have so far been poor.
India’s economy has certainly become more formal under Mr Modi, albeit at a high cost. The idea has been to draw activity out of the shadow economy, which is dominated by small and inefficient firms that do not pay tax, and into the formal sphere of large, productive companies.
Mr Modi’s most controversial policy on this front has been demonetisation. In 2016 he banned the use of two large-value banknotes, accounting for 86% of rupees in circulation—surprising many even within his government. The stated aim was to render worthless the ill-gotten gains of the corrupt. But almost all the cash made its way into the banking system, suggesting that crooks had already gone cashless or laundered their money. Instead, the informal economy was crushed. Household investment and credit plunged, and growth was probably hurt. In private, even Mr Modi’s supporters in business do not mince words. “It was a disaster,” says one boss.
Demonetisation may have accelerated India’s digitisation nonetheless. The country’s digital public infrastructure now includes a universal identity scheme, a national payments system and a personal-data management system for things like tax documents. It was conceived by Mr Singh’s government, but much of it has been built under Mr Modi, who has shown the capacity of the Indian state to get big projects done. Most retail payments in cities are now digital, and most welfare transfers seamless, because Mr Modi gave almost all households bank accounts.
Those reforms made it easier for Mr Modi to ameliorate the poverty resulting from India’s disappointing job-creation record. Fearing that stubbornly low employment would stop living standards for the poorest from improving, the government now doles out welfare payments worth some 3% of gdp per year. Hundreds of government programmes send money directly to the bank accounts of the poor.
It is a big improvement on the old system, in which most welfare was distributed physically and, owing to corruption, often failed to reach its intended recipients. The poverty rate (the proportion of people living on less than $2.15 a day), has fallen from 19% in 2015 to 12% in 2021, according to the World Bank.
Digitisation has probably also drawn more economic activity into the formal sector. So has Mr Modi’s other signature economic policy: a national goods and services tax (gst), passed in 2017, which knitted together a patchwork of state levies across the country. The combination of homogenous payments and tax systems has brought India closer to a national single market than ever.
That has made doing business easier—Mr Modi’s second objective. gst has been a “game-changer”, says B. Santhanam, the regional boss of Saint-Gobain, a large French manufacturer with big investments in the southern state of Tamil Nadu. “The prime minister gets it,” adds another seasoned manufacturing executive, referring to the need to cut red tape. The government has also put serious money into physical infrastructure, such as roads and bridges. Public investment surged from around 3.5% of gdp in 2019 to nearly 4.5% in 2022 and 2023.
The results are now materialising. Mr Subramanian recently wrote that, as a share of gdp, in 2023 net revenues from the new tax regime exceeded those of the old system. This happened even as tax rates on many items fell. That more money is coming in despite lower rates suggests that the economy really is formalising.
Yet Mr Modi is not satisfied with merely formalising the economy. His third objective has been to industrialise it. In 2020 the government launched a subsidy scheme worth $26bn (1% of gdp) for products made in India. In 2021 it pledged $10bn for semiconductor companies to build plants domestically. One boss notes that Mr Modi personally takes the trouble to convince executives to invest, often in industries where they face little competition and so otherwise might not.

Some incentives could help new industries find their feet and show foreign bosses that India is open for business. In September Foxconn, Apple’s main supplier, said it would double its investments in India over the coming year. It currently makes some 10% of its iPhones there. Also in 2023 Micron, a chipmaker, began work on a $2.75bn plant in Gujarat that is expected to create some 5,000 jobs directly and 15,000 indirectly.
So far, however, these projects are too small to be economically significant. The value of manufactured exports as a share of gdp has stagnated at 5% over the past decade, and manufacturing’s share of the economy has fallen from about 18% under the previous government to 16%. And industrial policy is expensive. The government will bear 70% of the cost of the Micron plant—meaning it will pay nearly $100,000 per job. Tariffs are ticking up, on average, raising the cost of foreign inputs.

So what matters more: Mr Modi’s failures or his successes? As well as economic growth, it is worth looking at private-sector investment. It has been sluggish during Mr Modi’s time in office (see chart 2). But a boom may be coming. A recent report by Axis Bank, one of India’s largest lenders, argues that the private-investment cycle is likely to turn, thanks to healthy bank and corporate balance-sheets. Announcements of new investment projects by private corporations soared past $200bn in 2023, according to the Centre for Monitoring Indian Economy, a think-tank. That is the highest in a decade, and up 150% in nominal terms since 2019.
Although higher interest rates have sapped foreign direct investment in the past year, firms’ reported intentions to invest in India remain strong, as they seek to “de-risk” their exposure to China. There is some chance, then, that Mr Modi’s reforms will kick growth up a gear. If so, he will have earned his reputation as a successful economic manager.
The consequences of Mr Modi’s policies will take years to be felt in full. Just as an investment boom could vindicate his approach, his strategy of using welfare payments as a substitute for job creation could prove unsustainable. A failure to build local governments’ capacity to provide basic public services, such as education, may hinder growth. Subhash Chandra Garg, a former finance secretary under Mr Modi, worries that the government is too keen on “subsidies” and “freebies”, and that its “commitment to real reforms is no longer that strong.” And yet for all that, many Indians will go to the polls feeling cautiously optimistic about the economic changes that their prime minister has wrought.
Saturday 30 December 2023
Thursday 28 December 2023
Wednesday 6 December 2023
Wednesday 30 August 2023
Tuesday 29 August 2023
A level Economics: How to Improve Economic Forecasting
Nicholas Gruen in The FT
Today’s four-day weather forecasts are as accurate as one-day forecasts were 30 years ago. Economic forecasts, on the other hand, aren’t noticeably better. Former Federal Reserve chair Ben Bernanke should ponder this in his forthcoming review of the Bank of England’s forecasting.
There’s growing evidence that we can improve. But myopia and complacency get in the way. Myopia is an issue because economists think technical expertise is the essence of good forecasting when, actually, two things matter more: forecasters’ understanding of the limits of their expertise and their judgment in handling those limits.
Enter Philip Tetlock, whose 2005 book on geopolitical forecasting showed how little experts added to forecasting done by informed non-experts. To compare forecasts between the two groups, he forced participants to drop their vague weasel words — “probably”, “can’t be ruled out” — and specify exactly what they were forecasting and with what probability.
That started sorting the sheep from the goats. The simple “point forecasts” provided by economists — such as “growth will be 3.0 per cent” — are doubly unhelpful in this regard. They’re silent about what success looks like. If I have forecast 3.0 per cent growth and actual growth comes in at 3.2 per cent — did I succeed or fail? Such predictions also don’t tell us how confident the forecaster is.
By contrast, “a 70 per cent chance of rain” specifies a clear event with a precise estimation of the weather forecaster’s confidence. Having rigorously specified the rules of the game, Tetlock has since shown how what he calls “superforecasting” is possible and how diverse teams of superforecasters do even better.
What qualities does Tetlock see in superforecasters? As well as mastering necessary formal techniques, they’re open-minded, careful, curious and self-critical — in other words, they’re not complacent. Aware, like Socrates, of how little they know, they’re constantly seeking to learn — from unfolding events and from colleagues.
Superforecasters actively resist the pull to groupthink, which is never far away in most organisations — or indeed, in the profession of economics as a whole, as practitioners compensate for their ignorance by keeping close to the herd. The global financial crisis is just one example of an event that economists collectively failed to warn the world about.
There are just five pages referencing superforecasting on the entire Bank of England website — though that’s more than other central banks.
Bernanke could recommend that we finally set about the search for economic superforecasters. He should also propose that the BoE lead the world by open sourcing economic forecasting.
In this scenario, all models used would be released fully documented and a “prediction tournament” would focus on the key forecasts. Outsiders would be encouraged to enter the tournament — offering their own forecasts, their own models and their own reconfiguration or re-parameterisation of the BoE’s models. Prizes could be offered for the best teams and the best schools and universities.
The BoE’s forecasting team(s) should also compete. The BoE could then release its official forecasts using the work it has the most confidence in, whether it is that of its own team(s), outsiders or some hybrid option. Over time, we’d be able to identify which ones were consistently better.
Using this formula, I predict that the Bank of England’s official forecasts would find their way towards the top of the class — in the UK, and the world.
Tuesday 22 August 2023
A level Economics: India's Economic Data could be fiction
T C A Sharad Raghavan in The Print
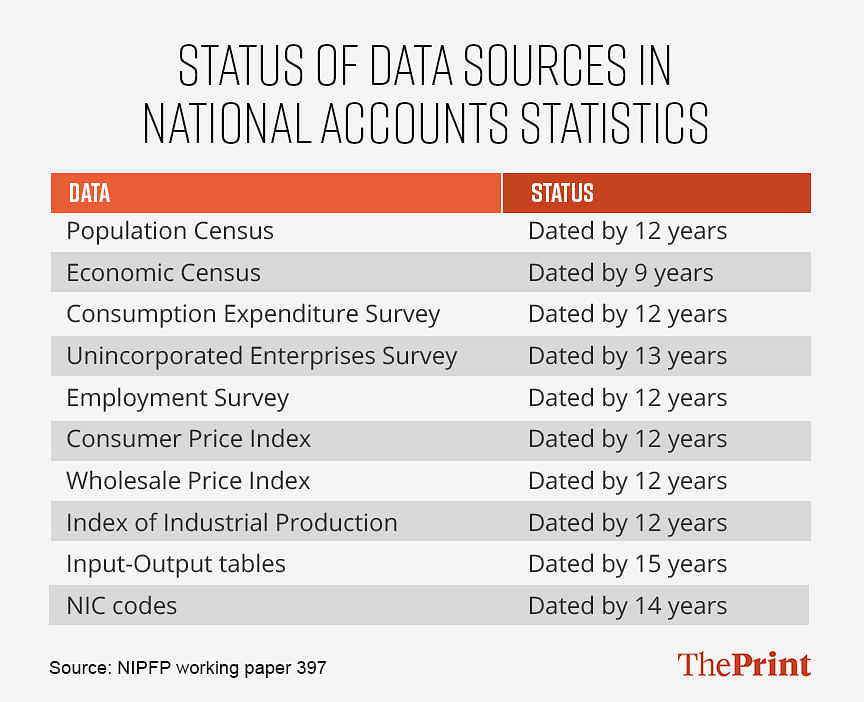
The next time somebody, even the Prime Minister, boasts about India being the fastest-growing economy or that it is the fifth largest in the world, ask them to prove it. Even Modi will not be able to. The reams of government data that will be thrown at you will almost all be incorrect, and the analysis done on them will be guesswork at best. The reason for this is not some convoluted statistical reasoning. It’s much simpler: the data is outdated and largely meaningless. The most recent actual data for the Indian economy we have is about 12 years old.
Amrit Kaal may be the target, but we don’t even know our starting point.
The old…
Let’s take something as conceptually simple as per capita gross domestic product (GDP)—basically the total output of the country divided by the population. It serves as a broad proxy to denote the wealth of an average Indian. Should be simple enough to calculate, right? Let’s start with the numerator, which is the GDP figure.
The agriculture sector probably has the most up-to-date data when it comes to the overall GDP measure, and even that comes with a delay of about two years. The Directorate of Economics and Statistics in the Ministry of Agriculture and Farmers Welfare compiles the data on India’s agriculture output for any given year, and releases four advance estimates, before the final figures come out about two years after the collection.
Such a ‘short’ delay of just two years might have been okay if agriculture formed a larger part of our GDP. But with a share of less than 20 per cent, accuracy of agricultural data, while important, doesn’t materially improve the quality of the overall GDP number.
From here, it just becomes worse.
The manufacturing sector is divided into the organised sector and the unorganised sector. Data for the organised sector used to come from the Annual Survey of Industries—but with a lag. Now it comes from the much more up-to-date MCA-21 database compiled by the Ministry of Corporate Affairs. That’s not the problem here. The unorganised sector is.
The unorganised or informal sector, by definition, is difficult to quantify because there are no formal metrics through which such an audit can take place. If you could effectively measure it, it would not be ‘unorganised’ or ‘informal’. Rather, it is ‘unorganised’ because you can’t measure it.
Policymakers have gotten around this problem by periodically doing a nation-wide survey. Using the findings of the survey of the informal sector, the statisticians in the government then arrive at a ratio that can neatly be multiplied by the size of the formal sector, to arrive at an approximation of the size of the informal economy.
So, let’s say the formal sector is Rs 100 in size, and the ratio they have arrived at is 1.25. The informal sector would then be estimated at Rs 125 (Rs 100 x 1.25), which then gives you the total economic output of the sectors being measured—Rs 225 (Rs 100 + 125).
Ideally, this would work well. However, at a time when the latest survey of the informal sector—the Unincorporated Enterprises Survey—is from about 13 years ago, well before demonetisation, GST, and Covid, we don’t really know what shape the informal sector is in right now.
Then we come to the services. Trade, hotels, restaurants, real estate, all have significant contributions to GDP and sizeable informal segments, all of which are based on surveys conducted in 2011-12 or thereabouts.
Just think about the sea change the Indian economy has witnessed since 2011—both the positive and the negative. Inequality has widened, but access to basic essentials has improved. Demonetisation wiped out 86 per cent of the cash in the system overnight. The indirect tax system was overhauled with GST. A pandemic disrupted the economy like never before.
And then there are the myriad smaller changes that over time become big. The movie theatre industry has changed so dramatically. An entire generation of entrepreneurs are minting money by creating two-minute videos, forget any sort of asset creation. None of these or the million other changes to the Indian economy over the last decade are being captured in the data.
So that’s the numerator of the per capita GDP formula—almost every aspect of it is outdated. The denominator is the population of India, measured by the Census of India. When was the latest one? You guessed it, 12 years ago!
…and the uncaptured
So, if the GDP number as well as the population size are both more than a decade old, then when somebody talks about the size of the economy or per capita income, what are they talking about? It’s not the present, for sure.
Our data issues don’t end there. The other big number on everybody’s mind is inflation. As this analysis shows, the Consumer Price Index—which is what the Reserve Bank of India uses to measure inflation—falls woefully short of truly measuring the impact of rising prices on the people. The weightage for food is too high, while that of fuel and services such as health, education, and transport and communication are too low.
So, you have a situation where the overall inflation rate gets affected by a change in the price of wheat, even though 80 crore Indians currently get it for free. Or you have a situation where fuel prices shoot up in response to global oil prices, but the overall inflation rate barely registers it. And, while the middle class increasingly prefers private hospitals and private schools (don’t forget tuition classes), this increased spending on health and education is not getting captured.
In fact, with the latest usable Household Consumption Expenditure Survey being only available for the year 2011-12, we actually have only a vague idea about how people are spending their money and how much they are earning.
It’s fine for developed countries like the US to not update their CPI for around 40 years—though even there it might be time for a revision—because the rate of change of these basic economic indicators is much lower there than in an emerging economy like India. Here, a decade is a long time, and a lot can change during it.
It’s not just these, though. Several lesser-known but key surveys that underpin the very basic estimates we have of the economy haven’t been updated in years. The Economic Census is nine years old, the employment survey is 12 years old, as is the base year of the Index of Industrial Production. The input-output tables, critical to measuring the relationship between the production and use of various items in the economy, are 15 years too old.
The government can say all it wants about Amrit Kaal arriving and India becoming a developed nation by 2047, but if it wants to seriously achieve this trajectory, it is first going to have to establish where we stand now.
A level Economics: Was your degree really worth it?
The Economist
Is university worth it? That question once seemed a no-brainer. For decades young adults in rich countries have flocked to higher education. Governments have touted college as a boon for social mobility and economic growth. Yet as fees rise and graduate earnings stagnate, disillusionment is growing. A poll published by the Wall Street Journal on March 31st suggests a crisis of confidence has worsened: 56% of Americans now believe a degree is no longer worth the time and money spent on it.
For an average undergraduate, at least, this is not consistent with the facts. In most places, for most learners, the financial returns to higher education remain extremely healthy. Yet undertaking a degree has become riskier. The rewards for the best performers are increasing, but a troublingly high share of students see negative returns from their studies.
New data sets, such as tax records, are illuminating this dispersion like never before. They can track how much students taking specific courses, at specific institutions, earn in later life. In time that detail will help students avoid the worst pay-offs and seize the best. Choice of subject and timely graduation matter hugely; choice of institution somewhat less so. It could also be useful to governments tempted to crack down on “low-value degrees”.
A boom in graduate earnings began in the 1980s in the rich world. Back then the difference between the salaries of people who gain at least a bachelor’s degree and those who do not—commonly called the “college-wage premium”—began to soar. In the 1970s an American with a university education was earning on average 35% more than a high-school graduate. By 2021 that advantage had risen to 66%.

Recently the wage premium in many countries has either stagnated or begun to fall. And in places that actually charge students for their degrees, costs have gone up (see chart 1). Tuition in England has soared from nothing in the late 1990s to £9,250 ($11,000) a year, the highest in the rich world. In America, the out-of-pocket fee paid by an average bachelor’s-degree student increased from $2,300 a year in the 1970s to some $8,000 in 2018, in real terms, according to Jaison Abel and Richard Deitz at the New York Federal Reserve. (Students at public universities often pay much less; those at private non-profits can pay a lot more.)
Yet the average degree remains valuable. In 2019 Mr Abel and Mr Deitz roughly estimated the annual financial return on the money that a typical American invests in a bachelor’s degree. They conclude that the typical rate of return for a bachelor’s degree is around 14%. That has dropped from a peak of 16% in the early 2000s. But it is still a princely sum. And it is well above the 8-9% that American graduates were recouping in the 1970s, before graduate wages, and tuition fees, began to soar. These calculations include not only fees but also the money individuals might expect to earn if they were working full-time instead.
The average hides a very wide range of outcomes, however. Until recently economists seeking to identify the winners and losers were mostly limited to surveys. The trend now is for governments, such as those of Britain and Norway, to proffer hefty, anonymised databases showing actual earnings for millions of university-goers. That makes it much easier to compare people like-for-like. The disaggregated data reveal that a high share of students graduate with degrees that are not worth their cost.
In England 25% of male graduates and 15% of female ones will take home less money over their careers than peers who do not get a degree, according to the Institute for Fiscal Studies (ifs), a research outfit. America has less comprehensive data but has begun publishing the share of students at thousands of institutions who do not manage to earn more than the average high-school graduate early on. Six years after enrolment, 27% of students at a typical four-year university fail to do so, calculate researchers at Georgetown University in Washington, dc. In the long tail, comprising the worst 30% of America’s two- and four-year institutions, more than half of people who enroll lag this benchmark.
Dropping out without any qualification is an obvious way to make a big loss. Taking longer than usual to graduate also destroys value (because it eats up years that might otherwise have been spent earning full-time). Both these outcomes are common. Across the rich world less than 40% of people studying for undergraduate degrees complete their courses in the expected number of years. About one-quarter still have no qualifications three years after that.

Choosing the right subject is crucial to boosting earning power. Negative returns are likeliest for Britons who study creative arts (less than 10% of men make a positive return), social care and agriculture (see chart 2). By far the best-earning degrees in America are in engineering, computer science and business. Negative returns seem especially likely for music and the visual arts. Using America’s available data to guess lifetime earnings by programme is a stretch. But Preston Cooper at freopp, a think-tank, ventures that more than a quarter of bachelor’s-degree programmes in America will lead to negative returns for most enrolled students.
What you study generally matters more than where you do it. That comes with caveats: the worst colleges and universities provide students with little value, whatever they teach. But on average people who enroll in America’s public universities get a better return over their lifetimes than students who go to its more prestigious private non-profit ones, reckon the Georgetown researchers. High fees at the non-profits is one of the reasons why.
Earnings data in Britain call into question the assumption that bright youngsters will necessarily benefit from being pushed towards very selective institutions, says Jack Britton of the ifs. In order to beat fierce competition for places, some youngsters apply for whatever subject seems easiest, even if it is not one that usually brings a high return. Parents fixated on getting their offspring into Oxford or Cambridge, regardless of subject, should take note. But there is also evidence that tackling a high-earning course for the sake of it can backfire. Norwegian research finds that students whose true desire is to study humanities, but who end up studying science, earn less after ten years than they probably otherwise would have.
Men have more reason than women to worry that their investments in higher education will be a bust. That is because they have a higher chance of earning well without a degree. University is a risk for those with mediocre school grades as they often earn less after graduation than better-prepared peers who hold the same degrees.
In Britain the return from a degree is generally higher for South Asian students than for white ones, as they tend to study subjects such as business, and generally lower for black students (compared with what people of the same race typically earn if they do not go to university). In America, Asian students seem to have the least trouble paying off their student debts, compared with white and black students.
Marks and markets
What are the implications of all this analysis? Already there are signs that the higher-education market is evolving. People are already searching out better returns of their own accord at different educational stages. In America the number of degrees conferred annually in English and in history fell by around one-third between 2011 and 2021. The number of degrees in computer science more than doubled in that time (see chart 3). Others are skipping college altogether. The number of people enrolling has fallen every year since 2011.

Institutions are also shifting by culling humanities. In February the trustees of Marymount University in Virginia voted to abolish majors in nine subjects including English, history, philosophy and theology. Calvin University in Michigan and Howard University in Washington, dc are among those which have abandoned classics. And archaeology’s future at the University of Sheffield in Britain looks precarious.
Employers are adapting, too. Firms are becoming a bit less likely to demand that job applicants have degrees, according to analysis by Joseph Fuller of Harvard Business School, and others. Tight labour markets and a desire for more diverse workers help explain why. A few years ago some 80% of the jobs that ibm, a tech giant, advertised in America required a degree, says Kelli Jordan, one of its vice-presidents. Now it is about half. “A degree does not have to be the only indicator of skills that someone may have,” explains Ms Jordan.
Should governments amplify these trends? In Estonia one-fifth of an institution’s funding depends on meeting a variety of targets; one relates to the share of students graduating on time. Similar systems exist in Finland, Israel, Lithuania and Sweden. Australia’s government is trying to encourage learners to make socially useful choices. In 2021 it doubled what undergraduates pay to study social sciences, political science or communications and halved the fee for nursing and teaching. Students do not appear much moved yet, possibly because of the generosity of Australia’s student-debt repayment terms. Britain’s government reckons it can alter behaviour by giving everyone in England an online account listing a maximum cash sum that they are entitled to borrow from the state for studies over their lifetime. The idea is to make school-leavers more parsimonious.
Others still splurge. President Joe Biden hopes that the Supreme Court will soon approve a plan, announced last year, to write off a big chunk of America’s student loans. He also wants a more lenient repayment system. The associated costs could mount to hundreds of billions of dollars over the next decade. Mr Biden also promises an official list of “low-financial value” courses. More compelling is talk of preventing feeble programmes from benefitting from federal student loans. But without an act of Congress this would mainly affect for-profit colleges (which enroll only a fraction of America’s learners).
To many, a growing focus on the financial returns to higher education is crude. Graduates in public service are bound to earn less than those on Wall Street. Many disciplines are worth studying for their own sake. Yet students frequently tell pollsters that improving their earning power is a priority. Good returns are vital to the poorest learners, for whom the financial burden of degrees is highest. Today bad degrees are surprisingly common. A combination of better information, market forces and smarter policy can reduce their prevalence.
Subscribe to:
Posts (Atom)