Search This Blog

Tuesday, 19 July 2016

Southern is a story of rail failure. But the real agenda is to crush the unions


This is the most farcical privatisation even by the comedic standards of British railways – and the aim is to defeat one of the last holdouts of organised labour


Illustration by Nate Kitch


 Aditya Chakrabortty in The Guardian


You work in an office, study at a further education college, want to visit your nan in her care home. Whoever you are, wherever you go, you rely on the trains to take you there. Except you can’t rely on them – not at all.

The only thing predictable about the service is that it’s always awful: the train you want is odds-on to be late or cancelled. If the next one is running, it’s so crammed you can’t get on. Every commute brims over with aggro. Wedged in overcrowded carriages, fellow passengers suffer panic attacks. The local newspaper reports how other commuters have missed work so often, they’ve lost their job; how students have missed exams or holidaymakers haven’t made flights.


Rail minister resigns as Southern commuter chaos continues


You read about a single mother forced to give up being a lawyer in London because dodgy trains mean she can never get home to put her son to bed. And you and everyone else are paying thousands each year for this shambles. To stand for dozens of miles and have extra hours, needless anxiety and gratuitous misery added on to your daily commutes.

If any of this sounds like you then my commiserations – for you are obviously a Southern Railway passenger.

At any other time, this summer’s chaos on the trains would have dominated the front pages. Even amid the turbulence of Brexit, it is still producing political ructions as big as the 50-foot hole that opened up under a south London track yesterday. This month, the transport select committee held an emergency sessionto find out why the service is in meltdown. Last week MPs staged an urgent debate in Westminster Hall, where they laid into Southern as a “joke”, “awful”, “terrible” and “rubbish”. Then they lambasted the government.

In turn, Claire Perry admitted she was “ashamed to be the rail minister”, but vowed to try to fix the situation “until I am kicked out”. The very next evening she quit. The new transport secretary, Chris Grayling, spent Monday hurriedly holding meetings on Southern, which is “top of [his] priority list”.

Britain is hardly short of political crises at the moment, but Southern surely counts as one. In an era of private-sector failure, this is one of the most extensive. Consider: Southern runs among the most economically important train services in the country. It manages 156 stations, covers 414 miles of track, and is responsible for around 600,000 journeys each day.

And it’s part of the largest train franchise in Britain, Govia Thameslink. Also known as GTR – majority owned by the Go Ahead group – it ferries commuters from across the south coast into London Bridge and Victoria. It takes tourists and business travellers to Gatwick and Luton airports. Its empire stretches from Peterborough to Tonbridge to Bognor Regis and Brighton. In a country that has, stupidly, bet everything on London, GTR is utterly crucial to the national economy.

And it does an appalling job. It cancels more trains than all the other rail firms in Britain put together. It boasts the worst record on significant lateness. It is the worst performing train operator of the lot. And it shows little sign of improving.

Its response last week to the cancellation of so many Southern trains was to issue a new timetable, removing one in six of its trains. Of all the oddities thrown up by rail privatisation, this must rank among the oddest: a train company in the business of running fewer trains.


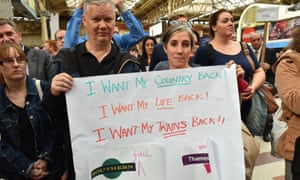
Southern rail passengers protest at Victoria station, London, July 2016. Photograph: Matthew Chattle/Rex/Shutterstock

Perhaps the sheer stretch of GTR’s network is part of the problem, even though Perry claimed just two years ago that that would help it “deliver a step-change on key routes”. Running services into London Bridge during a botched overhaul hasn’t helped. And going by the evidence GTR has given to parliament, it also inherited investment-starved services. But GTR’s boss Charles Horton comes from failed franchise Connex. In his first interview in his current job, he advised passengers forced to stand to take a later or slower service. And with staff morale at rock bottom he has ended up in a huge clash with the unions.

Southern has been crippled by industrial action. Horton also regaled MPs with stories of “sick-note strikes”, although David Boyle – whose blogs on the Southern mess have become a must-read – has found no evidence to back that up. Boyle instead discovered that employees are so fed up they will no longer do voluntary overtime – leaving the company with too few staff for its advertised services.

But the fundamental problem must be the most farcical privatisation even by the comedic standards of British railways. Because this is privatisation in name only. GTR is paid billions by the government – which then takes their ticket receipts and even refunds customers if the trains are delayed. This makes it unlike any other train company in Britain – and gives GTR no incentive to attract more customers or to stop annoying them. In effect, Horton and his executives are government agents paid lavishly for failing to provide a service.


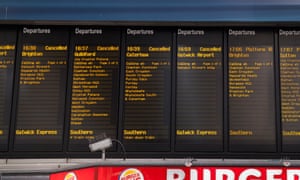
‘Southern cancels more trains than all the other rail firms in Britain put together.’ Photograph: Alicia Canter for the Guardian

We have a transport company that can’t really transport, and vast management fees paid to executives who clearly can’t manage. And the government acts as an apologist for a private company that’s meant to be providing a public service. Meanwhile, no apologies are forthcoming – in fact the boss of Go Ahead, David Brown, has just seen his annual pay soar above £2m, and the dividend payout to his shareholders has jumped to £37m. Someone is making a lot of money out of grotesque failure.

This is not just an issue for southern commuters, though – it’s a montage of everything wrong with business in Britain. Rather than strip GTR of its franchise, Tory ministers have instead made its conditions less onerous. Brown should be hauled in front of parliament to explain the chaos. Instead, he acts like an absentee landlord while officials at the Department for Transport say they couldn’t run the service as well as Southern does.

The question is why the government is going so easy on a failed train company. One answer comes from GTR’s dispute with the unions. The train firm wants to bring in driver-only trains, without guards to open and close the doors. The idea commands enthusiasm in Whitehall. It would certainly make rail management cheaper, if not safer.

But to strip trains of conductors requires the crushing of one of the last holdouts of organised labour. That’s not my extrapolation – it comes from DfT director Pete Wilkinson, who a few months ago told a public meeting, “We have got to break them [union members]. They have all borrowed money to buy cars and got credit cards. They can’t afford to spend too long on strike and I will push them into that place.”

Civil servants are supposed to be impartial, but this one wants to drive trade unions “out of my industry”. Mind you, Wilkinson has worked in Whitehall as well as in the City. He lives in Vienna but commutes to Britain. He’s a gamekeeper comfortable setting policy for the poachers. And he and his colleagues appear to be using Southern to take on the unions, in much the same way Thatcher used Ian MacGregor and the National Coal Board to break the miners.

An industrial dispute by proxy, a dysfunctional privatisation pushed by ideologues: our railways are in for an 80s revival for all the wrong reasons.

Mexico cuts poverty at a stroke – by changing the way it measures earnings

Change in methodology by national statistics institute provokes scepticism after it shows Mexico’s poor are richer by a third compared with last year


A girl stands in a slum in Mexico City. Mexico’s poor may not be feeling better off despite the latest report from the national statistics institute. Photograph: Alamy Stock Photo


David Agren in The Guardian


Mexico’s impoverished masses were up to 33.6% richer in 2015 than the previous year, according to the state-run statistics service.

But the change owes less to a sudden increase in actual wealth and wellbeing for the country’s poor than to unannounced changes in the methodology for measuring household earnings.

The changes make comparing poverty rates from one year to the next impossible – something acknowledged by the National Geography and Statistics Institute (Inegi).

But the tweak will allow image-conscious politicians to claim success in their anti-poverty programs and economic stewardship, even though public discontent over stagnant wages and rising prices remains widespread.


Pope's focus on violence and poor likely to make for 'uncomfortable' Mexico visit


“Basically what the Inegi is saying is: we’ve been overestimating poverty levels,” said Jonathan Heath, an independent economist in Mexico City.

“The way that they did this” – without public consultation – “raises suspicion,” he added.

“The new poverty numbers are certainly going to fall by a significant amount and it’s not due to improvements, it’s not due to government action, it’s not due to anything. It’s due to the way Inegi has carried out this survey,” he said.


The methodological changes were revealed on Friday with the release of the 2015 edition of the Survey of Socioeconomic Conditions, which showed an overall real increase of 11.9% in household earnings. In some states, the increase was more than 30%, while the poorest Mexicans saw the biggest gain in earnings, according to Inegi.


The changes came as a complete surprise to social scientists and non-governmental groups, but were justified by Inegi as an attempt at obtaining a truer measure of poverty – a notoriously tricky undertaking as people tend to underreport their incomes.


Inegi said in a statement that it applied new criteria in the collection and review of field data, which allows it to “offer society and the State a more precise measure of household earnings”.


Measuring poverty has proved controversial in Mexico, where social programs are often criticized as vote-buying exercises and beneficiaries in some states are told erroneously that their benefits are conditional on supporting the party in power.

Mexico used to measure poverty based on income, but changed its methodology in 2008 to take a “multidimensional” measure based on six social necessities, according to Heath.

The information collected by Inegi is provided to the National Council for the Evaluation of Social Development Policy (Coneval), an agency responsible for measuring poverty rates and the performance of social programs. Coneval put the poverty rate at 46.2% of the population in 2014, an increase of 0.7% points from 2012.


“[The] changes lack public technical documents to justify them,” Coneval said in a statement. It added the increase in household earnings “is not congruent with the trend that has been shown in other Inegi documents and with other economic variables”.

Monday, 18 July 2016

Why Good Storytellers Are Happier in Life and in Love


Studies find the way people tell their own stories has an outsize effect on their life satisfaction


Storytelling is one way couples bond when a relationship is young. But between long-term partners, the conversation often becomes mundane. Psychologists say it is important to keep telling and listening to each other’s stories. ILLUSTRATION: GARY HOVLAND FOR THE WALL STREET JOURNAL


By ELIZABETH BERNSTEIN


In William Shakespeare’s time, the word “conversation” meant two things—verbal discourse, and sex.

That’s how intimate the most well-known poet and playwright in the English language viewed the act of talking with another person.

Since the dawn of language, people have shared stories with others to entertain, persuade, make sense of what happened to them and bond. Research shows that the way people construct their individual stories has a large impact on their physical and mental health. People who frame their personal narratives in a positive way have more life satisfaction.

They also may be more attractive. New research, published this month in the journal Personal Relationships, shows that women find men who are good storytellers more appealing. The article consists of three studies in which male and female participants were shown a picture of someone of the opposite sex and given an indication of whether that person was a proficient storyteller. In the first study, 71 men and 84 women were told that the person whose picture they were looking at was either a “good,” “moderate” or “poor” storyteller. In the second study, 32 men and 50 women were given a short story supposedly written by the person in the picture; half the stories were concise and compelling, and half rambled and used dull language. In the third study, 60 men and 81 women were told whether the person in the picture was a good storyteller and were asked to rate their social status and ability to be a good leader in addition to their attractiveness.

The results were the same across all three studies: Women rated men who were good storytellers as more attractive and desirable as potential long-term partners. 

Psychologists believe this is because the man is showing that he knows how to connect, to share emotions and, possibly, to be vulnerable. He also is indicating that he is interesting and articulate and can gain resources and provide support.

“Storytelling is linked to the ability to be a good provider,” because a man is explaining what he can offer, says Melanie Green, an associate professor in the department of communication at the University at Buffalo and a researcher on the study. The men didn’t care whether the women were good storytellers, the research showed.

It feels wonderful to tell someone your stories when you are first becoming intimate. Think of the people you have been in love with in your life. I bet that at least once early in your relationship you stayed up all night talking, telling stories that were revealing and illuminating. That deep communication is sexy.

Stories are profoundly intimate, says Kari Winter, a historian and literary critic at the University at Buffalo. “It is empowering to the teller because they get recognition from the listener. And it is empowering to the listener because it helps them understand the teller.”

The problem is that once the heady early days of bonding are over, the conversation in a long-term relationship often turns mundane: Couples talk about jobs, schedules, the children. Is there any less inspiring question than “How was your day, honey?”

Psychologists say it’s important to keep telling each other stories. They help you remember why you were attracted to each other in the first place. In tough times, they help you make sense of what has happened. Many marriage therapists have couples in crisis each explain their side of events and then weave their stories into one cohesive narrative. “It’s a way to build and maintain a bond over shared history,” says Anna Osborn, a licensed marriage and family therapist in Sacramento, Calif.

How can you use storytelling to continue to bond in your relationship? Here are some tips.

Remember the basics. Every good story contains several core elements, Dr. Winter, of the University at Buffalo, says. The emotions and lessons of the story must be true, even if the story itself is a fantasy. (Think of the Harry Potter stories.) It must have a structure, including a beginning, middle and end. It needs a voice. And it has character development. If you are telling your own story, you need to reveal yourself.

Set aside story time. Find a time and a place where you aren’t rushed and there are no distractions. Then banish the humdrum. “Do not talk about household management issues. Do not talk about the kids,” says Ms. Osborn, the marriage therapist. Agree that this is time to tell stories of things that have happened that are meaningful to you. “Storytelling time should be an invitation to your partner to come into your world,” she says.


Start with your “firsts.” If you aren’t used to telling each other stories, it’s useful to have a few topics ready. Your first anything—date, kiss, dance, car, child, house—is a great place to start. The story of how you met can be particularly powerful and connecting, because it is, essentially, your origin story. And it’s always a happy memory. “Everything was pure then, nothing hurt yet,” Ms. Osborn says.


Tell stories of the past, present and future. Highlighting great memories or successes that you had together in the past helps you reconnect. Narrating recent events that have happened to you, or telling a story about a challenge you are facing, helps illuminate what matters to you. Weaving a story of a future event as you’d like it to happen—a vacation, a child’s wedding, the dance at your 60th anniversary party—can help you visualize what you want for your relationship.


Include your emotions. Show, don’t tell. (“She was wearing a red silk dress and my palms got sweaty.”) “Details can unlock the emotional truths that until now were never spoken out loud,” says Lauren Dowden, a social worker at Northwestern University Feinberg School of Medicine’s Cognitive Neurology and Alzheimer’s Disease Center, as well as a Second City alumna and teacher. She runs a storytelling group for couples where one partner has Alzheimer’s.


Conversely, good stories avoid certain things—cliché, digression, saying too much, not saying enough, lack of attention to the audience and preachiness


Practice. Storytelling is an art form, like playing the piano or creating a garden, says Dr. Winter, the literary critic. “You can start with something simple and it might be satisfying, but it might not be as good or as true as it can be.”


Dr. Winter suggests the three Rs: Reflect on the events. Refine what they meant to you. Read. “Learn from the masters,” she says.

A nine-point guide to spotting a dodgy statistic

 
Boris Johnson did not remove the £350m figure from the Leave campaign bus even after it had been described as ‘misleading’. Photograph: Stefan Rousseau/PA


David Spiegelhalter in The Guardian

I love numbers. They allow us to get a sense of magnitude, to measure change, to put claims in context. But despite their bold and confident exterior, numbers are delicate things and that’s why it upsets me when they are abused. And since there’s been a fair amount of number abuse going on recently, it seems a good time to have a look at the classic ways in which politicians and spin doctors meddle with statistics.

Every statistician is familiar with the tedious “Lies, damned lies, and statistics” gibe, but the economist, writer and presenter of Radio 4’s More or Less, Tim Harford, has identified the habit of some politicians as not so much lying – to lie means having some knowledge of the truth – as “bullshitting”: a carefree disregard of whether the number is appropriate or not.

So here, with some help from the UK fact-checking organisation Full Fact, is a nine-point guide to what’s really going on.

Use a real number, but change its meaning


There’s almost always some basis for numbers that get quoted, but it’s often rather different from what is claimed. Take, for example, the famous £350m, as in the “We send the EU £350m a week” claim plastered over the big red Brexit campaign bus. This is a true National Statistic (see Table 9.9 of the ONS Pink Book 2015), but, in the words of Sir Andrew Dilnot, chair of the UK Statistics Authority watchdog, it “is not an amount of money that the UK pays to the EU”. In fact, the UK’s net contribution is more like £250m a week when Britain’s rebate is taken into account – and much of that is returned in the form of agricultural subsidies and grants to poorer UK regions, reducing the figure to £136m. Sir Andrew expressed disappointment that this “misleading” claim was being made by Brexit campaigners but this ticking-off still did not get the bus repainted.


George Osborne quoted the Treasury’s projection of £4,300 as the cost per household of leaving the EU. Photograph: Matt Cardy/Getty Images


Make the number look big (but not too big) 

Why did the Leave campaign frame the amount of money as “£350m per week”, rather than the equivalent “£19bn a year”? They probably realised that, once numbers get large, say above 10m, they all start seeming the same – all those extra zeros have diminishing emotional impact. Billions, schmillions, it’s just a Big Number.

Of course they could have gone the other way and said “£50m a day”, but then people might have realised that this is equivalent to around a packet of crisps each, which does not sound so impressive.

George Osborne, on the other hand, preferred to quote the Treasury’s projection of the potential cost of leaving the EU as £4,300 per household per year, rather than as the equivalent £120bn for the whole country. Presumably he was trying to make the numbers seem relevant, but perhaps he would have been better off framing the projected cost as “£2.5bn a week” so as to provide a direct comparison with the Leave campaign’s £350m. It probably would not have made any difference: the weighty 200-page Treasury report is on course to become a classic example of ignored statistics.


Recent studies confirmed higher death rates at weekends, but showed no relationship to weekend staffing levels. Photograph: Peter Byrne/PA


Casually imply causation from correlation

In July 2015 Jeremy Hunt said: “Around 6,000 people lose their lives every year because we do not have a proper seven-day service in hospitals….” and by February 2016 this had increased to “11,000 excess deaths because we do not staff our hospitals properly at weekends”. These categorical claims that weekend staffing was responsible for increased weekend death rates were widely criticised at the time, particularly by the people who had done the actual research. Recent studies have confirmed higher death rates at weekends, but these showed no relationship to weekend staffing levels.


Choose your definitions carefully

On 17 December 2014, Tom Blenkinsop MP said, “Today, there are 2,500 fewer nurses in our NHS than in May 2010”, while on the same day David Cameron claimed “Today, actually, there are new figures out on the NHS… there are 3,000 more nurses under this government.” Surely one must be wrong?

But Mr Blenkinsop compared the number of people working as nurses between September 2010 and September 2014, while Cameron used the full-time-equivalent number of nurses, health visitors and midwives between the start of the government in May 2010 and September 2014. So they were both, in their own particular way, right.


‘Indicator hopper’: Health secretary Jeremy Hunt. Photograph: PA


Use total numbers rather than proportions (or whichever way suits your argument)

In the final three months of 2014, less than 93% of attendances at Accident and Emergency units were seen within four hours, the lowest proportion for 10 years. And yet Jeremy Hunt managed to tweet that “More patients than ever being seen in less than four hours”. Which, strictly speaking, was correct, but only because more people were attending A&E than ever before. Similarly, when it comes to employment, an increasing population means that the number of employed can go up even when the employment rate goes down. Full Fact has shown how the political parties play “indicator hop”, picking whichever measure currently supports their argument.


Is crime going up or down? Don’t ask Andy Burnham. Photograph: PA

Don’t provide any relevant context

Last September shadow home secretary Andy Burnham declared that “crime is going up”, and when pressed pointed to the police recording more violent and sexual offences than the previous year. But police-recorded crime data were de-designated as “official” statistics by the UK Statistics Authority in 2014 as they were so unreliable: they depend strongly on what the public choose to report, and how the police choose to record it.

Instead the Crime Survey for England and Wales is the official source of data, as it records crimes that are not reported to the police. And the Crime Survey shows a steady reduction in crime for more than 20 years, and no evidence of an increase in violent and sexual offences last year.
Exaggerate the importance of a possibly illusory change


Next time you hear a politician boasting that unemployment has dropped by 30,000 over the previous quarter, just remember that this is an estimate based on a survey. And that estimate has a margin of error of +/- 80,000, meaning that unemployment may well have gone down, but it may have gone up – the best we can say is that it hasn’t changed very much, but that hardly makes a speech. And to be fair, the politician probably has no idea that this is an estimate and not a head count.
Serious youth crime has actually declined, but that’s not because of TKAP. Photograph: Action Press / Rex Features


Prematurely announce the success of a policy initiative using unofficial selected data

In June 2008, just a year after the start of the Tackling Knives Action Programme (TKAP), No 10 got the Home Office to issue a press release saying “the number of teenagers admitted to hospital for knife or sharp instrument wounding in nine… police force areas fell by 27% according to new figures published today”. But this used unchecked unofficial data, and was against the explicit advice of official statisticians. They got publicity, but also a serious telling-off from the UK Statistics Authority which accused No 10 of making an announcement that was “corrosive of public trust in official statistics”. The final conclusion about the TKAP was that serious youth violence had declined in the country, but no more in TKAP areas than elsewhere.


  Donald Trump: ‘Am I going to check every statistic?’
Photograph: Robert F. Bukaty/AP


If all else fails, just make the numbers up

Last November, Donald Trump tweeted a recycled image that included the claim that “Whites killed by blacks – 81%”, citing “Crime Statistics Bureau – San Francisco”. The US fact-checking site Politifact identified this as completely fabricated – the “Bureau” did not exist, and the true figure is around 15%. When confronted with this, Trump shrugged and said, “Am I going to check every statistic?”

Not all politicians are so cavalier with statistics, and of course it’s completely reasonable for them to appeal to our feelings and values. But there are some serial offenders who conscript innocent numbers, purely to provide rhetorical flourish to their arguments.

We deserve to have statistical evidence presented in a fair and balanced way, and it’s only by public scrutiny and exposure that anything will ever change. There are noble efforts to dam the flood of naughty numbers. The BBC’s More or Less team take apart dodgy data, organisations such as Full Fact and Channel 4’s FactCheck expose flagrant abuses, the UK Statistics Authority write admonishing letters. The Royal Statistical Society offers statistical training for MPs, and the House of Commons library publishes a Statistical Literacy Guide: how to spot spin and inappropriate use of statistics.

They are all doing great work, but the shabby statistics keep on coming. Maybe these nine points can provide a checklist, or even the basis for a competition – how many points can your favourite minister score? In my angrier moments I feel that number abuse should be made a criminal offence. But that’s a law unlikely to be passed by politicians.

David Spiegelhalter is the Winton Professor of the Public Understanding of Risk at the University of Cambridge and president elect of the Royal Statistical Society