Search This Blog

Showing posts with label home. Show all posts

Friday 2 August 2013

Home Office is now a tool for stirring up racial tension

Dave Garret in The Independent 01/08/2013

Over the last few weeks we’ve seen some very visible signs of the Government’s “hostile environment” crusade. There have been vans out on the streets with threatening slogans and, reportedly, non-white people being visibly stopped and searched.
The Home Office is responsible for community cohesion. Yet we are increasingly seeing what appears to be hostility towards non-white immigration, which will do nothing but incite racial tensions and divisions within otherwise rich and diverse communities.
This has to change. We urgently need a more balanced public debate on immigration, free of political agendas. Without it we risk eroding the very foundations of communities across the UK.
The Government has now made the Home Office, who are also responsible for community policing and safety, a highly visible, taxpayer-funded tool for stirring up racial tension and community unrest. The method and location of these stunts make it hard to believe that they are not targeted at non-white communities, but, whatever the truth, they are certainly perceived that way.
Refugee Action wants to see a more balanced debate about immigration, and believes the Home Office has a huge responsibility to avoid adding to its toxicity. At least in the interests of balance, we’d like some vans which say: “The NHS would collapse without foreign-born staff,” or “the Office of Budget Responsibility says that migration has a positive impact on the sustainability of public finances” or “without immigration Britain would be without tea”.
Dave Garratt is chief executive of Refugee Action

Monday 1 July 2013

Not talking about death only makes it more lonely and frightening


In the absence of faith, death cafes can provide a space for us to talk about what a good ending might be
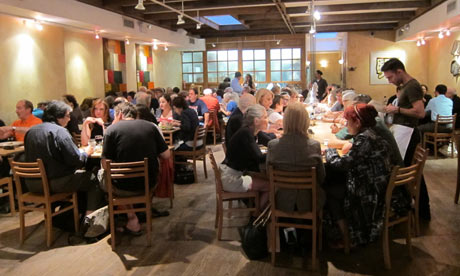
New York death cafe
‘The idea of the death cafe has caught on, with more than a hundred meetings having taken place in Britain and the United States.'
This is a familiar scenario. I am sitting at the side of somebody's bed in hospital. They are dying. It's not an especially comfortable bed, being designed for ease of cleaning and to help nurses lift patients safely. The sound environment is punctuated by the noise of other people's distress and intermittent bleeping from the apparently reassuring presence of technology – often referred to as life-saving, though of course it can never really deliver on that promise. The flimsy curtain provides little privacy.
Friends and relatives arrive and tell the patient they are looking "really well". This is often code for: we don't want to talk about the fact that you are dying. Anyway, the priest is here. He can do all that existential stuff. The people in white coats obviously have the physical aspect of things covered. The patient, emotionally drained by illness, colludes with this distressing lie through a simple "thank you". It's distressing because the patient often wants to talk about it. Not talking about it is lonely and thus all the more frightening. Is this really how we want to die?
When Jon Underwood introduced the idea of the Death Café into the English speaking world in 2011 as an offshoot of the Swiss Café Mortel movement, it was with the belief that we have outsourced all talk of death to medics, priests and undertakers. This displacement of death-talk from everyday speech, he suggested, robs us of agency over one of the most significant things we will ever have to face. First, he approached local cafes in east London to see if they would host a gathering to talk about death. They thought the idea bizarre, ghoulish. So he set up in his front room and asked his mum to lead the first session.
Since then the idea has caught on and more than a hundred meetings have taken place in the UK and the US. It's not a space for religious proselytising – though people of all faiths and none are welcome. It is not for the recently bereaved. It's more a way of addressing the ever-present reality of death among those for whom it is not a live issue. "It can be very liberating because the way our society shuts down conversations about death can be claustrophobic and stifling," says Underwood.
My own religious perspective on death and dying is that secular atheism is proving to be a very expensive and a terrible burden on the NHS. When we come to value life simply in terms of itself and "the amount of self-referential advancement obtained in it", as one commentator has put it, then death is seen as doubly frightening because it strikes not just at life itself, which is bad enough, but at the very core of our value system. Medicine thus shoulders the unreasonable burden of justifying our existence. So we charge the medics to do everything they can to keep us alive. And the bills pile up.
Most of us want to die quickly and before our physical condition deteriorates to such an extent that life becomes intolerable. But this is a comforting avoidance – the fantasy of "getting out of life alive", as theologian Stanley Hauerwas puts it. As is all talk of euthanasia: the figures from those places where it is legal demonstrate that only a tiny percentage of people ever choose this route. In an aging population, most of us will die gradually. In the absence of religious belief, we need to develop a language that will help us address what a good death might look like.
Can we, for instance, start talking about having a natural death in the same way that we can now talk about having a natural birth? Or about dying at home, surrounded by our loved ones and not by machines? Discussions like this might enable us to get off the escalator to intensive care, that miserable and soulless place where more and more of us are now dying.

Monday 22 October 2012

What happens to a Lottery winner?


Lottery millionaires each fund six jobs a year, study shows

3,000 £1m-plus winners have created another 3,780 millionaires among family and friends and contributed £750m to GDP
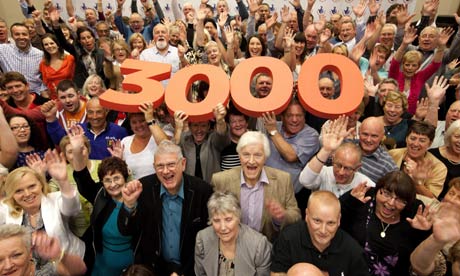
National Lottery millionaires
Some of the National Lottery's 3,000 millionaire winners. Photograph: David Parry/PA
The balls have dropped and all six numbers match, so it's time to buy that Audi, book the holiday in the US and phone the estate agent. At least, that's what most lottery millionaires do, according to an analysis of spending and investment by jackpot winners.
Since its launch in 1994, the lottery has created 3,000 millionaires who have won more than £8.5bn in total, at an average of £2.8m each. The trickle-down effect means that between them they have created a further 3,780 millionaires among their children, family and friends, according to the forecasting consultancy Oxford Economics.
Most winners (59%) give up work straight away, but 19% carry on doing the day job and 31% do unpaid voluntary work. The good news for the economy is that 98% of winners' spending remained in the UK. Through their spending on property, vehicles and holidays, it is estimated that each winner keeps six people in a full-time job for a year.
Winners have contributed almost £750m to GDP, and generated more than £500m in tax receipts for the Exchequer. The bulk of the money went on property, with £2.72bn spent on winners' main properties, and £170m in paying off existing debt and mortgages.
Maintaining income was a priority, with £2.125bn spent on investments. Gifts to family and friends accounted for £1.17bn, and £680m was spent on cars and holidays.
The study, commissioned by Camelot to mark the 3,000 winners milestone, was based on research from 100 £1m-plus winners. It found that in total the 3,000 winners have purchased 7,958 houses or flats in the UK, or 2.7 each, spending £3.3bn. Most winners (82%) changed their main residence, spending an average £900,000.
The new home is likely to come with a hot tub, with almost a third (29%) putting that on their shopping list. A walk-in wardrobe was a must for 28%, almost a quarter (24%) opted for a property behind electric gates, and 22% had a games room, with 7% installing a snooker table.
Larger properties need maintaining, and 30% of winners employed a cleaner and 24% a gardener. A small proportion (5%) employed a beautician.
Audis were the favourite cars of 16% of winners, with Range Rovers and BMWs also popular purchases (11% each), as well as Mercedes (10%) and Land Rovers (5%). Winners spent £463m on 17,190 cars, with the average price of their favourite being £46,116.
Holidays were also a priority. The majority (68%) choose five-star hotels overseas. The US was the favoured destination for 27%, followed by the Caribbean (9%). Closer to home, however, UK caravan sales have benefited. Over the past 18 years, 10% of millionaires have bought a caravan, generating sales worth about £7.4m.
Some winners (15%) have started their own businesses, 9% have helped others to do so, and 6% have invested in or bought other people's businesses. Businesses started or supported by lottery winners employ 3,195 people, according to the study.
Andy Logan, co-analyst and author of the report, said: "The effect of a win spreads much further and wider than we anticipated. Not only does it transform the lives of friends and family, but each win has a measurable effect on the UK economy, especially with so much of it being spent in the UK. The use of each win creates a ripple effect across this generation and very often the next."

Friday 24 August 2012

Performance Analysis of international cricket teams since 2006


S Rajesh in Cricinfo
After hanging on to the No. 1 spot for a year, England have relinquished it to South Africa, and Andrew Strauss, their captain, was quick to acknowledge that Graeme Smith's team thoroughly deserved the honour, given their recent form. England had an extremely dominant spell when they won eight out of nine series, but since then, they've lost two out of four, and both by convincing margins - 3-0 to Pakistan and 2-0 to South Africa.
South Africa's strong run, on the other hand, has been going on for much longer: since December 2006, in 20 series, they've won 13, drawn six, and lost only one - to Australia at home in 2009, immediately after beating them in Australia earlier in the season. During this period they've won two series in England, and one each in Pakistan, Australia, New Zealand and West Indies. They haven't won a series in India in two attempts, but each time they've won a Test and drawn the series. The only country in which South Africa didn't win or draw their last series is Sri Lanka - they lost 2-0 in July-August 2006.
The big difference between the recent records for England and South Africa has been the teams' overseas performance. During England's powerful run between 2009 and 2011, most of their emphatic wins were achieved in England: Australia was the only major opposition they beat in an away series - their other overseas win was in Bangladesh, while they drew in South Africa. On the other hand, they beat West Indies, Australia, Pakistan, Sri Lanka and India at home.
India's ascent to the top spot in December 2009 was also largely based on home wins, though they also had two creditable series wins in England (in 2007) and New Zealand (2009), But out of seven series wins between 2007 and 2009, four were achieved at home - against Pakistan, Australia, England and Sri Lanka - and one in Bangladesh. On the other hand, they lost series in Australia, South Africa and Sri Lanka during this period.
South Africa's move up the table, though, has been based on wins both home and away. In 27 away Tests since December 2009, they have a 14-4 win-loss record, with no series losses. That record dips slightly in home Tests, to 16-9 in 28 matches, with one series defeat in ten.
The table below compares the records for all teams since December 2006, excluding Tests against Zimbabwe and Bangladesh. Though Australia have a marginally better overall win-loss record during this period, South Africa have been the overwhelming champions in away Tests: they have a win-loss ratio of 3, while none of the other teams has managed even half that. England, on the other hand, have a ratio of 0.5, exactly the same as India.
Teams in Test cricket since December 2006 (excl. Tests v B'desh and Zim)
TeamTestsW/LRatioAway TestsW/LRatio
South Africa5126/ 132.002512/ 43.00
Australia6134/ 162.122912/ 91.33
Pakistan4010/ 160.623610/ 150.66
England6927/ 211.28317/ 140.50
India5921/ 181.16338/ 160.50
Sri Lanka4513/ 140.92203/ 100.30
New Zealand374/ 210.19171/ 120.08
West Indies466/ 220.27231/ 130.07
A closer look at the overseas stats indicates the major differentiator between South Africa and the other teams: it's the ability of their batsmen to retain the ability to make huge scores even when playing in unfamiliar conditions. Several teams have better batting averages in home Tests than South Africa: India average 47.82, Australia 40.96, England 40.29, and Sri Lanka 39.94, while South Africa are fifth, on 35.62. (All stats exclude Tests against Zimbabwe and Bangladesh).
However, in away games, South Africa's batting is a long way better than other teams: they average 44.93, and the next best are Australia on 35.51. Even allowing for the fact that away Tests for other teams include matches in South Africa, where conditions are toughest for batting these days, the difference is huge. India's batting average overseas falls to 31, while England are slightly better at 33.48.
One of the key stats here is the number of hundreds scored by South African batsmen: in 25 overseas Tests, they've scored 41 hundreds and 55 fifties. That works out to an average of 1.64 hundreds per Test, and a fifties-to-hundreds ratio of 1.34. Both are significantly better than those of other teams. India, for example, average 0.70 hundreds per Test, and have a fifties-to-hundreds ratio of 4.26. That South African ability to convert starts into big scores was evident in the series in England too, when they turned five out of ten 50-plus scores into hundreds, including three scores of more than 180.
Meanwhile South Africa have always been blessed with high-quality bowlers, which means the efforts of their batsmen haven't gone waste. However, three other teams - Australia, Pakistan and England - have bowling averages that are similar to those of South Africa. The key difference has been the ability of the batsmen to rack up huge scores, no matter what the conditions.
Overseas stats for all teams since Dec 2006 (excl. Tests in B'desh and Zim)
TeamTestsBat ave100s/ 50sWkts takenBowl ave
South Africa2544.9341/ 5539534.16
Australia2935.5134/ 7948433.37
Pakistan3629.0522/ 9059332.66
England3133.4834/ 7247135.85
India3331.0023/ 9848740.12
Sri Lanka2033.4527/ 3721650.09
New Zealand1724.877/ 3021439.93
West Indies2329.6319/ 5326945.17
Among batsmen who have scored 1500-plus overseas runs since December 2006 (excluding matches in Bangladesh and Zimbabwe), four of the top eight averages belong to South Africans. Hashim Amla and AB de Villiers have 65-plus averages, while Jacques Kallis and Graeme Smith average more than 54.
Some of the top batsmen from other teams have struggled overseas during this period. Rahul Dravid averaged only 35.10 in 33 Tests, Ricky Ponting 36.82, Virender Sehwag 36.97, and Michael Hussey 37.34. VVS Laxman averaged 70.45 in home Tests during this period, but in overseas games his average dropped to 41.35. (Click here for the full list of batsmen in overseas games, with a 1500-run cut-off.)
Best overseas batsmen since Dec 2006 (Qual: 1500 runs, excl Tests in B'desh and Zim)
BatsmanTestsRunsAverage100s/ 50s
Hashim Amla25248665.428/ 11
AB de Villiers25214765.065/ 9
Shivnarine Chanderpaul19160761.805/ 10
Kumar Sangakkara19197258.009/ 6
Jacques Kallis24208257.8310/ 6
Chris Gayle16151756.184/ 4
Misbah-ul-Haq24186754.913/ 15
Graeme Smith25228654.428/ 10
A further break-up for these four South African batsmen shows how adept they have been against both pace and spin in overseas Tests. Amla and de Villiers average more than 70 against pace, and more than 60 against spin. Kallis' average against pace, and Smith's against spin, drop below 50, but they're still pretty impressive numbers.
On the other hand, some of the other top batsmen from other sides have struggled against either pace or spin, or in some cases both, in overseas matches. For the Indians, pace has been the problem: Dravid averaged 34.67 against fast bowling, Laxman 35.50, Sehwag 37.93 and Tendulkar 43.40; against spin Tendulkar and Laxman average more than 60, and Dravid 46.42. For England, Pietersen and Cook average marginally more than 40 against pace in overseas matches, but Ian Bell's average drops to 37.68; against spin, Cook averages 73.46, and Pietersen 48.15. Ponting averages 35 against pace and Hussey 30; against spin their averages are 61 and 52. Kumar Sangakkara, Sri Lanka's best batsman, averages 54 against pace and 64 against spin, but Jayawardene's average against pace is only 29.29.
South Africa thus have a core group of batsmen who've proved themselves to be top-class against both pace and spin in overseas Tests. There was a time when India's top four were similarly capable as well, but they didn't always have the bowling support to convert their batting class into victories. Dale Steyn and Co have ensured that South Africa don't face that problem, and the result is a well-deserved top spot in Test cricket. The challenge now will be to ensure they don't slip up like India and England did.
South Africa's top batsmen v pace and spin in overseas Tests (excl. B'desh and Zim)
BatsmanPace-runsDismissalsAverageSpin-runsDismissalsAverage
Hashim Amla14572072.8510291664.31
AB de Villiers11761578.409631564.20
Jacques Kallis9502047.5011071669.18
Graeme Smith14312459.628171845.38