Showing posts with label NDA. Show all posts
Showing posts with label NDA. Show all posts
Saturday, 8 June 2024
Friday, 16 December 2022
An NDA from Harvey Weinstein cost me my career – at last, banning them feels within reach
Why are these extreme confidentiality clauses still used in the UK to protect the perpetrators of abuse? asks Zelda Perkins in The Guardian

More than two decades ago, I walked into the offices of a law firm in Soho, my 24-year-old self confident that it would help me to expose and address the appalling behaviour of my then boss, the film producer Harvey Weinstein. His attempted rape of a new assistant while we were at the Venice film festival – on her first occasion alone with him – put me on the path I knew was right. The frightening but clear and proper course to justice.
But nothing could have prepared me for the ways in which the legal system would fail my colleague and me so thoroughly, or for the irreversible impact of entering – on our law firm’s advice – into a damages contract containing extreme confidentiality clauses, otherwise known as a non-disclosure agreement, or NDA.
Due to the enormous disparity of power and wealth between Weinstein and ourselves, we were given no choice but to sign the agreement. The NDA not only forbade us from talking about Weinstein’s behaviour, but also about our entire career at Miramax – to family, friends, medical practitioners including therapists, even to HMRC if questioned about the damages payment. We were to use our “best endeavours” to limit what we said in any future criminal or civil action taken against him, and let him know if we were approached . We were not even allowed to have a copy of the document that was to control our lives “in perpetuity”. And it seemed clear to us that we could face jail and financial ruin if we breached it.
My attempt to report on Weinstein’s behaviour cost me my career. While he collected Oscars, I endured job interviews where men openly questioned me about my “relationship” with Weinstein, but I was gagged from telling the truth. The inability to find a job or speak freely drove me to move my life abroad.
Today Weinstein is in an LA jail, awaiting a verdict from an LA court at his second trial for sexual assault and rape. He is already serving 23 years for sexual assault. She Said, the film about the two New York Times journalists who broke the story, is playing in cinemas around the world, exposing how his reign of terror came to be and the mechanisms that protected him. So why am I still having to talk about this issue, five years on from breaking my NDA to those New York Times journalists? I had believed that by uncovering the system that enabled Weinstein and others in power, things would change. In many places they have, but not here in the UK.
Over the past 25 years NDAs have become the default solution for settling cases of sexual misconduct, racism, pregnancy discrimination and many other human rights violations. They are sold as helping the victim by protecting their name, where in fact a simple one-sided confidentiality clause would do that. In reality NDAs serve only to protect an employer’s reputation and the career of the perpetrator, allowing abusers to continue their behaviour while victims lose both their jobs and the ability to warn others about the individual or the workplace. Settling an employment dispute involves agreeing not to take any further legal action – it should not be a deal to protect or hide abuse.

In 2018 I, along with others, gave testimony to the women and equalities select committee about how NDAs were being abused in the UK. The Conservative government vowed it would “end NDAs being used unethically” but the recommendations of the select committee and the following consultation by the Department for Business, Energy and Industrial Strategy were ignored. Not one change has been made. And so in workplaces across the country, abusers are still protected – and every week my email inbox is full of desperate messages from people (mostly women) being forced into silence.
They come from all industries – media organisations, corporations and public services. From the testimonies and data we are collecting, we know that NDAs also have a disproportionate impact on those who are already vulnerable. Black women are three times more likely to sign an NDA than white women. Women are five times more likely to sign an NDA than men.
But it doesn’t have to be like this, as we can see from progress in the US, Canada, Ireland and Australia. Over the last five years 15 US states have changed their legislation around NDAs and this November, in a historic move, Joe Biden supported a bill through Congress stopping the use of NDAs in cases of sexual misconduct. Ironically, on the same day, our deputy prime minister, Dominic Raab, claimed in the House of Commons, when questioned about an alleged NDA, that it was merely a “confidentiality agreement”. As a lawyer, he well knows the two are one and the same.
Although it is shocking that in the UK the legal mechanism that protected Weinstein is still protecting abusers, there are glimmers of hope. Earlier this year the Department for Education, in conjunction with Can’t Buy My Silence, the campaign I co-founded with Prof Julie Macfarlane in 2021, introduced a voluntary pledge for UK universities and colleges of higher education to stop using NDAs. So far 60% in England have signed up, meaning 1.5 million students are protected from being gagged about abuse.
The common sense behind this call has clearly been heard elsewhere – as last week the Lords added an amendment to the new higher education freedom of speech bill, banning the use of NDAs in universities and colleges in cases of sexual harassment, bullying or discrimination. If this becomes law then there is an even clearer signal to our government that it is time to change the system and outlaw this legal tool in all workplaces. To add to this the government has just backed legislation that would make sexual harassment in the street a criminal offence – this is a huge stride, at last acknowledging and protecting women from the daily abuses they endure.
There is nothing ethical about a legal agreement that hides bullying, racism or any form of assault and works purely to protect powerful wrongdoers. It would be both morally correct and economically wise to ban the use of NDAs. What a legacy it would be if Rishi Sunak were to make all workplaces safer and more productive – protecting not just women but anyone who faces discrimination or harassment.
Tuesday, 24 October 2017
How do Non Disclosure Agreements Work?
Shannon Bond and Jane Croft in FT
Many of the women who have spoken about sexual harassment by Harvey Weinstein, the Hollywood film producer, signed non-disclosure agreements. Such agreements have been criticised for being a tool used by the wealthy and powerful to silence victims.
Many of the women who have spoken about sexual harassment by Harvey Weinstein, the Hollywood film producer, signed non-disclosure agreements. Such agreements have been criticised for being a tool used by the wealthy and powerful to silence victims.
What is an NDA?
An NDA is a legal agreement signed between two parties to share confidential information or to keep trade secrets private. They are widely used in the business world, such as in mergers and acquisitions, where one company receives sensitive financial information about a business it wants to buy.
“The original legitimate point of a non-disclosure agreement is for people to talk about business ideas together and make sure someone does not run off and start their own venture,” says Robert Ottinger, founder of the Ottinger Firm, a US employment law practice.
NDAs are also used in employment settlements so that workers cannot speak about events that happened during their employment, such as sexual harassment.
“What is absolutely de rigueur in our business these days is the employer pays you money and you will never say anything about it again,” says Kathleen Peratis, head of the sex discrimination and sexual harassment practice group at the New York law firm Outten & Golden.
“They’ve been used more lately to hide people’s dirty secrets. The consequence is the public never knows,” Mr Ottinger says. “We sign settlement agreements every week, and you can’t tell anyone but your spouse, your accountant and your lawyer.”
How secure are NDAs?
NDAs are legally binding. However, once confidential information enters the public domain, there is a question as to how an NDA could be enforced.
“If the information is something very, very bad, such as allegations of sexual harassment against an employer, there is a public interest argument that this should not be covered up,” says one UK employment lawyer. “If other women who have not signed NDAs suddenly start speaking out then there is a question of whether the information is still confidential or has now entered the public domain. If it is now deemed as public, an employer would be unlikely to succeed in the courts if they sought damages against someone who has breached an NDA.”
Ms Peratis says clients have recently asked about the consequences of breaking their confidentiality agreements. “What I say is, you made a deal. If you choose to violate that deal, you are at risk of having this guy demand what the contract allows him to demand. But I also tell them, if you’re the first to come out with this your risk is high. If you’re the third or fourth, your risk is not so high.”
In the UK, lawyers reject the idea that there will be a flood of parties breaching NDAs in light of the Weinstein case. However, there is a possibility that the use of gagging clauses may be curbed, particularly in the UK public sector, which have historically been used to stop workers flagging safety concerns.
What is the legal position for an employee who breaks an NDA?
In both the UK and US, an ex-employee can be sued for breaching a confidentiality agreement. A company can seek damages from the former staff member and can try to claw back all or part of any financial settlement. In the UK, they can also seek an injunction preventing the former employee from speaking out again.
Paul Quain, partner at GQ Employment Law, says UK employment settlement agreements usually have a clause in the agreement that allows ex-employees to speak out about confidential information if they are “required by law, HMRC [HM Revenue & Customs], any regulatory body”.
This means that an ex-employee would be able to speak to UK lawmakers at a parliamentary select committee hearing, to UK tax investigators or to the UK financial regulator despite having signed such an NDA.
In the US, NDAs cannot lawfully prevent people from reporting claims to law enforcement and government agencies, such as the Equal Employment Opportunity Commission, or responding to a subpoena.
US federal law does stop “employers from preventing employees from their right to engage in what are called ‘concerted activities’,” says Maya Raghu, director of workplace equality at the National Women’s Law Center in Washington. “That can include restraining or preventing employees from discussing sexual harassment complaints among themselves. That can be an unfair labour practice.”
How does an NDA differ from a non-disparagement agreement?
Non-disparagement agreements are more specific than NDAs and mean that both parties (such as an employer and employee) agree not to make derogatory or adverse statements about each other.
Are the numbers of NDAs increasing?
Mr Quain says the number of NDAs has been increasing since the 1970s and 1980s as companies have become more concerned that sensitive information could be leaked. “It may be that companies started to get their fingers burnt and confidential information was made public. They are now pretty standard in employment settlement agreements,” he says.
Ms Peratis recalls the first time she saw such an agreement mooted, about 40 years ago. “I said to the lawyer on the other side, ‘Ah, you want silence. That’s going to cost you a little more.’”
Today, she says, “no conversation like that ever occurs any more because it is absolutely expected that with every single employment settlement agreement there will be a confidentiality agreement . . . Anybody who says these days I am not going to agree to confidentiality is not going to get a deal.”
Monday, 24 March 2014
Has Modi's Gujarat grown faster and better than the rest of India?
Two academics hold Gujarat up against other states to see if it grew more in the Modi decade than in the preceding 20 years
The forthcoming election, it seems, will be fought mainly on issues of governance and economic performance. To the extent there is a focus on the personalities involved, such as Narendra Modi or Rahul Gandhi or Arvind Kejriwal or potential ‘Third Front’ candidates such as Nitish Kumar or Mamata Banerjee, most of the discussion is about their economic track record or lack thereof. This is a welcome development. However, in the grand theatre of Indian politics, facts often take a backseat to slogans, and opinions get sharply polarised. For example, we either hear that Gujarat’s economic performance has been nothing short of miraculous due to the magic touch of Modi or that Gujarat’s so-called growth story is all hype and a PR campaign aimed at covering up a dark underbelly of poverty, inequality and low levels of human development indicators.
 A lot of this debate reflects disagreements about two sets of issues. First, there are many dimensions of economic performance—we could look at the level of per capita income, the growth rate of per capita income, human development indices (HDI) that put weight on not only income but also on non-income measures like education and health, the level of inequality, percentage of people below the poverty line, and many others. Which index we choose to emphasise reflects either our preferences as to the aspect of economic performance we value the most, or our views as to which dimension has to be improved (say, per capita income) for bettering the dimension we care about (say, poverty alleviation).
Secondly, even if we focus on one particular dimension of economic performance, how do we attribute changes in this dimension to the role of a specific leader? For example, how do we isolate the contribution of Narendra Modi and Nitish Kumar to the growth of Gujarat and Bihar, respectively, in the 2000s, especially as the country as a whole experienced a growth spurt in this period?
Therefore, the first issue is how to separate the leader’s contribution from other factors driving his or her state’s performance, for example, a general improvement in the economic environment of the country that benefits all states. The solution to this problem is to calculate the difference between the growth rate of the state for the years this leader was in power and the average growth rate of the rest of the states during the same period of time. If this difference is positive, then it is safe to say that the state under this leader grew faster than the rest of the country.
However, this is not enough. What if the state in question was always growing faster than the rest of the country? How can we then isolate the specific role of this leader?
To give an analogy, to show that a company’s performance under a new CEO has improved, it is not sufficient to show that the performance of the firm has been above average relative to that of other firms after the new CEO took over, as it is possible that this firm was already ahead of others. Similarly, if we find that a firm beat its past record under the new management, we cannot automatically attribute this to the CEO, as it is possible that all firms performed better in this period due to positive changes in the economic environment. To claim that this CEO had a transformative impact on the firm, we need to show not only that this firm stayed ahead of other firms after he took over but that its performance margin relative to other firms improved significantly under him.
Thus, returning to the example of Modi, in order to claim that his leadership had a significant impact on Gujarat’s economic performance, it is not enough to show that the state did better than the rest of India after he came to power in 2001. We have to demonstrate that the gap between Gujarat’s performance and that of the rest of India actually increased under his rule. This is a statistical method called ‘differences in differences’. It is routinely used to evaluate the performance of organisations under a particular management or the effectiveness of a particular government policy.
Turning to evidence, we look at the following key indices of economic performance—level of per capita income, its growth rate, HDI, inequality and the percentage of population below the poverty line—for the major Indian states. All through, we have focused on the major 16 states in terms of population. The larger a state, the harder it is to achieve improvements in per capita average economic indicators. Therefore, comparing a large state like Uttar Pradesh and a small one like Nagaland can be misleading; it is better to compare like with like. However, we have to keep in mind that even among the major states, turning around a state with a larger population is a harder task.
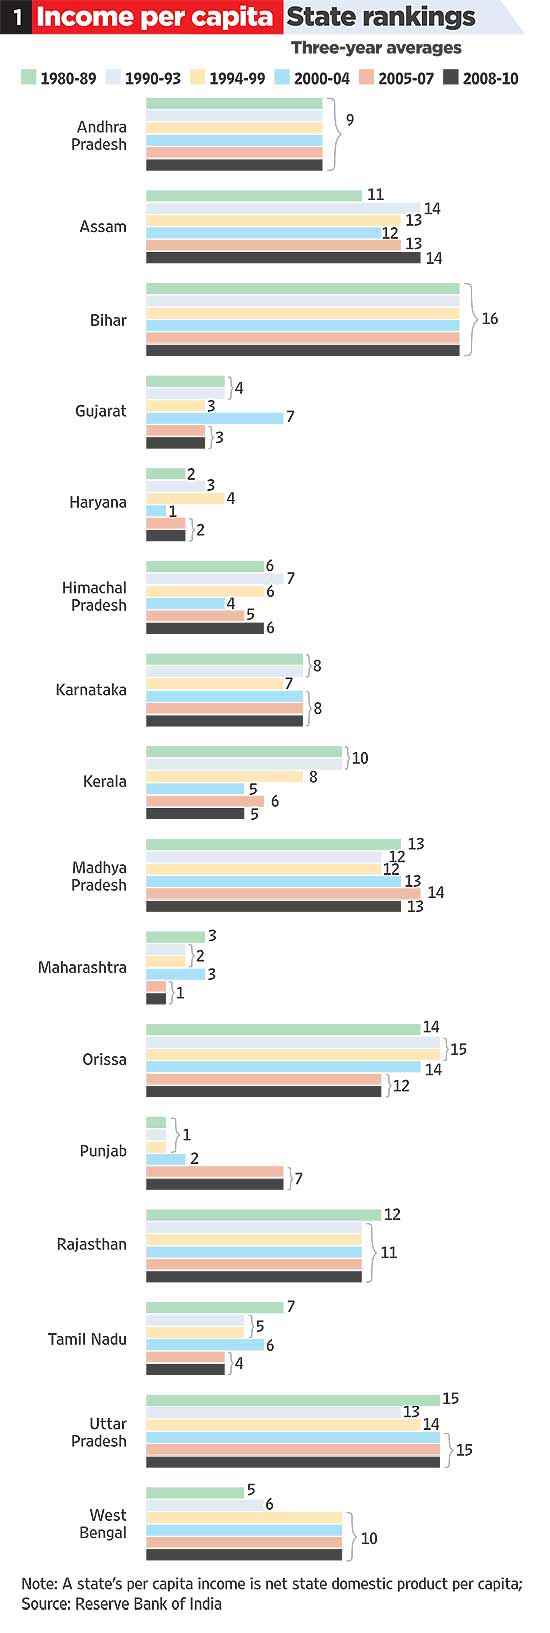
We begin by looking at the most obvious economic indicator—the level of per capita income. In terms of average per capita income ranking of states over the 1980s, ’90s and 2000s, the top three states are Haryana, Punjab and Maharashtra (see Table 1). Gujarat’s average rank is 4. On the other hand, Bihar, which has been in the news lately due to its spectacular turnaround over the recent years under the leadership of Nitish Kumar, has been consistently at the bottom of this league with a rank of 16, below UP, which too has remained steady at number 15.
In terms of improving their relative ranking over the three decades, the top performers among the leading states are Maharashtra, Gujarat, Kerala and Tamil Nadu. Between the ’80s and now, Maharashtra has moved from 3 to 1, Gujarat from 4 to 3, Kerala from 10 to 5 and Tamil Nadu from 7 to 4. Interestingly, the rise in the ranks of these four has been accompanied by the relative decline of Punjab, which went from being the very top state in the ’80s and ’90s to No. 7 in 2010. This suggests that, as in athletic races, the relative rank of a state may go up or down either due to a change in its own performance or due to a change in the rival’s performance.
Thus, to obtain a fuller picture of the economic performance of these states, we also need to consider their relative growth performances. The relative ranking at a given point of time as in Table 1 gives only a snapshot of where states stand in terms of economic performance. But as we know from athletic races, unless that point happens to be the finishing line, it is the rate at which an athlete is accelerating that determines the final outcome. While there is no final finishing line in the race of economic development, the current growth performance of a state can give an indication of its potential position in the future. Is the rise in rankings of states like Maharashtra and Gujarat also matched by a faster growth rate on their part? Also, are there states that are lower down in the ranking but are growing faster than average and so can hope to improve their ranking in the future?
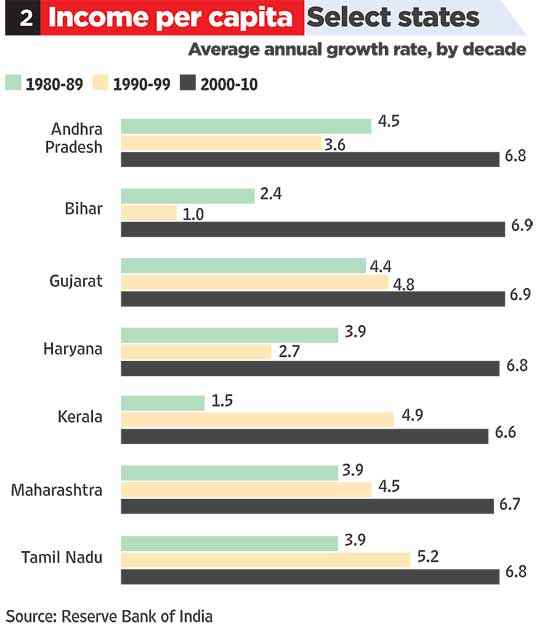
Table 2 documents the annual average growth rates of states which have performed better than national average (leaders) in each of the three decades. Only three states have had above average growth performance in all three decades: Gujarat, Tamil Nadu and Maharashtra. They were joined by Andhra Pradesh, Bihar, Haryana and Kerala in the 2000s.
Interestingly, the growth rate of Punjab, initially one of the top-ranked states in terms of per capita income level, has been below the national average in the last two decades. Thus it is not surprising that it is slipping down in rank below other faster-growing states. Bihar, on the other hand, is poised to rise up the ranks with a higher than average growth rate of per capita income in the 2000s. In a way, Bihar’s story is the opposite of Punjab’s: while it is still at the bottom of the chart in terms of the level of per capita income, it can expect to improve its rank if it maintains its recent high growth rate.
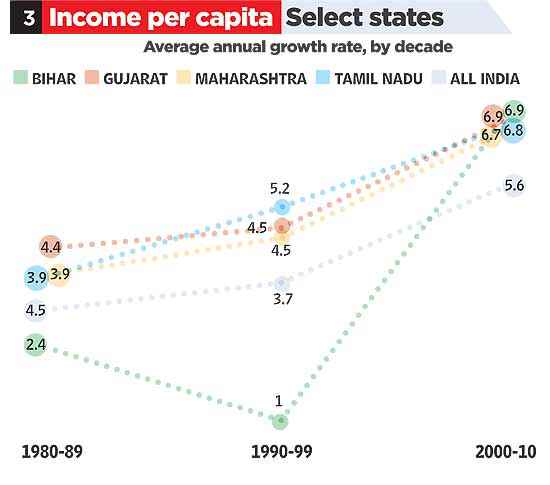
Now we come to one of the key questions. Which are the states that improved their performance in the 2000s both with respect to their past performance in the earlier two decades, and with respect to the performance of other states in the 2000s? Table 3 graphically plots the average annual growth rates of five states against the national average over time. This graph shows an interesting trend: while Gujarat, Tamil Nadu and Maharashtra have been going neck and neck (and Haryana, which is not shown in the figure), and as already mentioned, have consistently performed above the national average, none of them has experienced a huge acceleration in growth rate in the 2000s. In contrast, Bihar, which was consistently doing worse than the national average through the ’80s and ’90s, shot up above the national average in the 2000s, converging to rates achieved by established leaders like Gujarat, Maharashtra and Tamil Nadu.
To sum up, we see that Maharashtra, Haryana, Punjab, Gujarat and Tamil Nadu have been among the richest states in the last three decades. In the 2000s, the big news was Punjab dropping from the top 5 and Kerala breaking into this select group. Among the rest, Maharashtra ended as the topper in the latter half of the 2000s, and Gujarat at a very respectable number 3, after Haryana. In terms of growth performance, Gujarat, Tamil Nadu and Maharashtra were the toppers over the last three decades but in the 2000s, three other states raised their game to join the list of fastest-growing states: Bihar, Haryana and Andhra Pradesh. However, if any state could claim that its performance relative to the rest of India actually improved in the 2000s, that state is Bihar.
Therefore, if awards must be given, Bihar deserves the prize for the most dramatic turnaround in the 2000s. Gujarat gets credit for having steadily been on top of the league in terms of both the level of per capita income and its growth rate, but has to share the honours with Maharashtra and Haryana in that category. However, there is no evidence of any significant growth acceleration in Gujarat in the 2000s.
One could argue that it is easier to turn around a state that was at the bottom of the league like Bihar than to maintain, or to marginally improve, the performance of a state already at the top of the league, like Maharashtra, Haryana or Gujarat. After all, there is greater scope for improvement in the former case. Conversely, one could also argue that it is more challenging to turn around a backward state, because if it were easy, someone would have done it already. This is reinforced by the argument that Bihar is the third largest state, whereas Gujarat’s rank is 10th in terms of population, and it is difficult to achieve sharp improvements in a larger than a smaller state.
Be that as it may, many would argue that per capita income and its growth—the indices we have considered so far—are only partial measures of economic development. Among other things, these indices ignore aspects of development that are not captured in income, for example, life expectancy or education. Nor do these take into account income inequality or the extent of poverty. Therefore, we now turn our attention to the performance of the states in terms of the Human Development Index (HDI), level of inequality and the percentage of people below the poverty line.
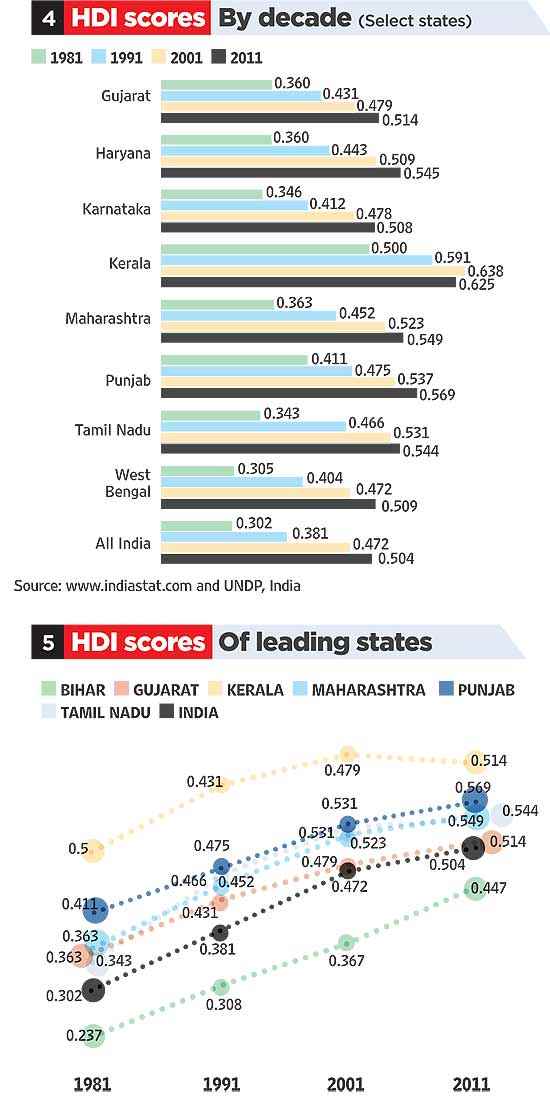
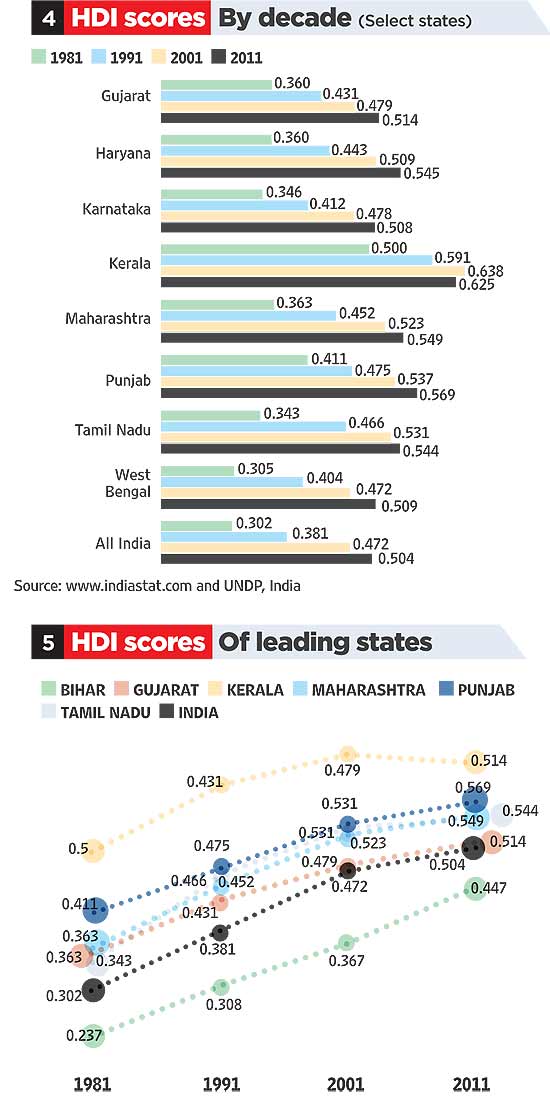
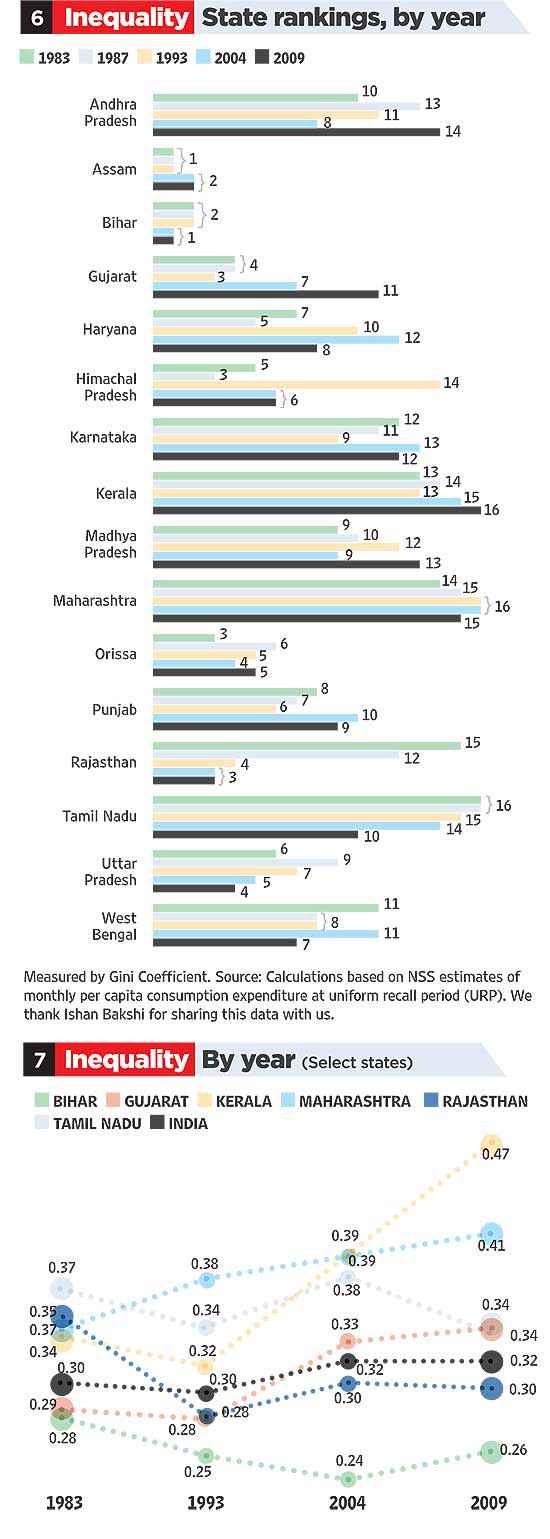 Table 4 highlights HDI scores of the seven states with HDI scores above the national average over the last three decades. These are Kerala, Punjab, Maharashtra, Haryana, Tamil Nadu, Gujarat and Karnataka. Table 5, on the other hand, plots the performance of some selected states with respect to the all-India average in terms of HDI. As we would expect, Kerala’s performance is literally off the charts. Maharashtra, Tamil Nadu and Gujarat, on the other hand, appear to have been going head to head. Their trends tell an interesting story. While Gujarat’s HDI performance was above the national average in the ’80s and ’90s, it decelerated in the 2000s and came down to the national average. In contrast, Tamil Nadu and Maharashtra, which started off at a similar level of HDI as Gujarat in the ’80s, have continued to perform better than the national average in the 2000s. Bihar, on the other hand, has consistently been below the national average, but it has made significant improvements over the last decade and shows signs of catching up to the national average.
Thus, the HDI rankings of states present a different story than their rankings of per capita income levels or growth rates, with one exception. The only state that is in the top 3 in all the rankings so far is Maharashtra. Otherwise, the top prize for HDI goes to Kerala, and “the most improved in the 2000s” prize goes to Bihar.
Next, we look at a few states’ ranking in terms of level of inequality (see Table 6) based on consumption expenditure. Assam and Bihar have consistently had the lowest levels of inequality according to this index. However, the state that really stands out, both in terms of relative ranking and absolute decline in inequality, is Rajasthan. Between the early ’80s and late 2000s, Rajasthan’s relative ranking improved from 15th to third, while its inequality measure fell by 14 per cent, the largest decline for any state. On the contrary, states that are leaders on the growth dimension are found to perform worse on inequality. For example, it’s evident from Table 7 that while inequality in Gujarat was lower than the national average in the ’80s and ’90s, it actually rose to levels above the national average in the 2000s. Maharashtra, Tamil Nadu and Kerala, too, have consistently recorded higher levels of inequality than the rest of India, with Kerala showing a sharp spike in the 2000s.
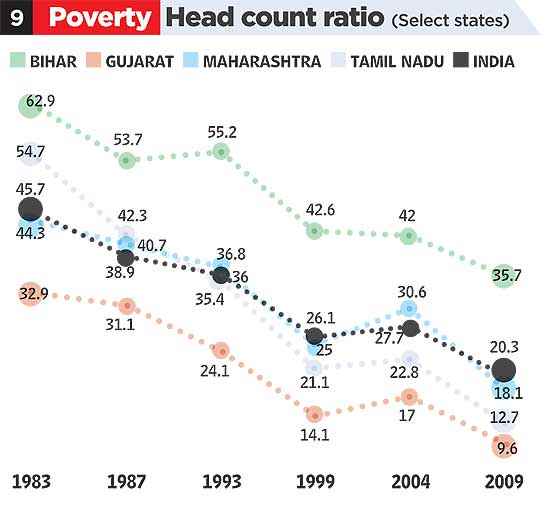
Lastly, we consider the percentage of population below the poverty line (see Table 8). We find that Himachal Pradesh, Punjab, Kerala, Gujarat, Haryana, Andhra Pradesh and Karnataka have consistently had lower levels of poverty than the all-India average. Gujarat’s performance in poverty reduction over the years has been similar to that of Andhra Pradesh and Kerala. However, if we look at improvements in performance over the last decade, then Tamil Nadu is one of the top performers. Starting from a level of poverty that was higher than the national average in 1983, it ended up at a much lower level, similar to those of Gujarat, AP and Kerala, in 2009 (see Table 9). Bihar, although well above the national average in terms of poverty levels all through the three decades, has shown a sharp improvement over the last decade.
Is there, then, a clear answer to the question we had started with: did Gujarat truly outshine other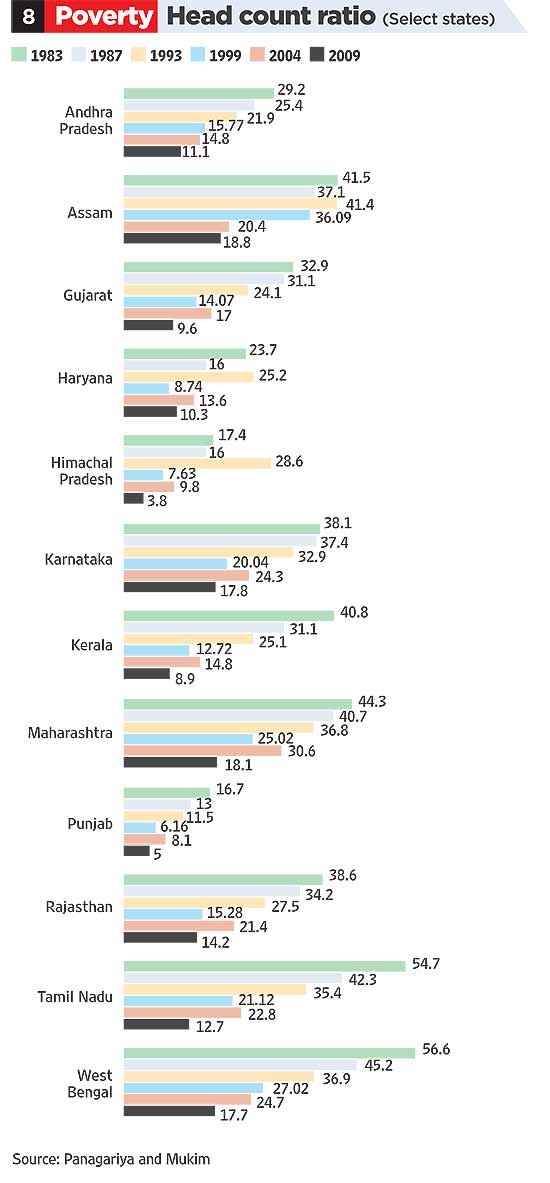 states in the 2000s in terms of economic development? If we simply look at the figures, four facts will jump out: first, Bihar has improved the most in the 2000s, even though it has been at the bottom of the list for all indicators and still has a fair distance to go before it can go above the national average; second, Kerala has far outpaced other states in terms of HDI all through; third, Rajasthan was the star performer in terms of reducing inequality; and fourth, Maharashtra and Gujarat have consistently been top performers in terms of per capita income and its growth, with Haryana and Tamil Nadu deserving mention too. All these achievements are noteworthy but it is hard to single out any state as the top performer in the 2000s.
To the extent this assessment goes against the view held by many people independent of their political leanings that Gujarat has done spectacularly well under Mr Modi, the explanation lies in our ‘differences in differences’ approach.
In particular, this is what we tried to figure out: did a state that has for a long time been one of the most developed states in terms of per capita income, and was already improving at a rate higher than the rest of the country, accelerate further and significantly increase its growth margin under Modi’s stewardship? Our analysis shows that this did not happen. Both Maharashtra and Gujarat improved upon an already impressive growth trajectory in the 2000s, but the margin of improvement was too small to be statistically meaningful. So while Gujarat’s overall record is undoubtedly very good all through the last three decades, its performance in the 2000s does not seem to justify the wild euphoria and exuberant optimism about Modi’s economic leadership.
Of course, it is possible that there are trends that this evidence cannot capture. Maybe with a longer time horizon, the effects of some of Modi’s policies will show up in the evidence, although given that he is now in his fourth consecutive term of power, this argument is not very strong. It is also possible that if Modi comes to power at the Centre, he may well achieve a turnaround of the Indian economy due to his governance style. All that is possible in theory, but the existing evidence is insufficient to support these views.
As John Maynard Keynes had famously said in the context of stockmarket bubbles, often our decisions to do something, the full consequences of which will be drawn out over many days to come, can only be “taken as the result of animal spirits”—a spontaneous urge to action rather than inaction or rational calculation. In politics, too, maybe it is animal spirits that rule, not rational calculations based on statistical evidence. However, while election campaigns are run on slogans and sentiments, good governance depends on facts and figures. Bubbles eventually burst, waves of euphoria recede. At some point, the numbers need to add up.
A lot of this debate reflects disagreements about two sets of issues. First, there are many dimensions of economic performance—we could look at the level of per capita income, the growth rate of per capita income, human development indices (HDI) that put weight on not only income but also on non-income measures like education and health, the level of inequality, percentage of people below the poverty line, and many others. Which index we choose to emphasise reflects either our preferences as to the aspect of economic performance we value the most, or our views as to which dimension has to be improved (say, per capita income) for bettering the dimension we care about (say, poverty alleviation).Secondly, even if we focus on one particular dimension of economic performance, how do we attribute changes in this dimension to the role of a specific leader? For example, how do we isolate the contribution of Narendra Modi and Nitish Kumar to the growth of Gujarat and Bihar, respectively, in the 2000s, especially as the country as a whole experienced a growth spurt in this period?
Therefore, the first issue is how to separate the leader’s contribution from other factors driving his or her state’s performance, for example, a general improvement in the economic environment of the country that benefits all states. The solution to this problem is to calculate the difference between the growth rate of the state for the years this leader was in power and the average growth rate of the rest of the states during the same period of time. If this difference is positive, then it is safe to say that the state under this leader grew faster than the rest of the country.
However, this is not enough. What if the state in question was always growing faster than the rest of the country? How can we then isolate the specific role of this leader?
To give an analogy, to show that a company’s performance under a new CEO has improved, it is not sufficient to show that the performance of the firm has been above average relative to that of other firms after the new CEO took over, as it is possible that this firm was already ahead of others. Similarly, if we find that a firm beat its past record under the new management, we cannot automatically attribute this to the CEO, as it is possible that all firms performed better in this period due to positive changes in the economic environment. To claim that this CEO had a transformative impact on the firm, we need to show not only that this firm stayed ahead of other firms after he took over but that its performance margin relative to other firms improved significantly under him.
Thus, returning to the example of Modi, in order to claim that his leadership had a significant impact on Gujarat’s economic performance, it is not enough to show that the state did better than the rest of India after he came to power in 2001. We have to demonstrate that the gap between Gujarat’s performance and that of the rest of India actually increased under his rule. This is a statistical method called ‘differences in differences’. It is routinely used to evaluate the performance of organisations under a particular management or the effectiveness of a particular government policy.
Turning to evidence, we look at the following key indices of economic performance—level of per capita income, its growth rate, HDI, inequality and the percentage of population below the poverty line—for the major Indian states. All through, we have focused on the major 16 states in terms of population. The larger a state, the harder it is to achieve improvements in per capita average economic indicators. Therefore, comparing a large state like Uttar Pradesh and a small one like Nagaland can be misleading; it is better to compare like with like. However, we have to keep in mind that even among the major states, turning around a state with a larger population is a harder task.
We begin by looking at the most obvious economic indicator—the level of per capita income. In terms of average per capita income ranking of states over the 1980s, ’90s and 2000s, the top three states are Haryana, Punjab and Maharashtra (see Table 1). Gujarat’s average rank is 4. On the other hand, Bihar, which has been in the news lately due to its spectacular turnaround over the recent years under the leadership of Nitish Kumar, has been consistently at the bottom of this league with a rank of 16, below UP, which too has remained steady at number 15.
In terms of improving their relative ranking over the three decades, the top performers among the leading states are Maharashtra, Gujarat, Kerala and Tamil Nadu. Between the ’80s and now, Maharashtra has moved from 3 to 1, Gujarat from 4 to 3, Kerala from 10 to 5 and Tamil Nadu from 7 to 4. Interestingly, the rise in the ranks of these four has been accompanied by the relative decline of Punjab, which went from being the very top state in the ’80s and ’90s to No. 7 in 2010. This suggests that, as in athletic races, the relative rank of a state may go up or down either due to a change in its own performance or due to a change in the rival’s performance.
Thus, to obtain a fuller picture of the economic performance of these states, we also need to consider their relative growth performances. The relative ranking at a given point of time as in Table 1 gives only a snapshot of where states stand in terms of economic performance. But as we know from athletic races, unless that point happens to be the finishing line, it is the rate at which an athlete is accelerating that determines the final outcome. While there is no final finishing line in the race of economic development, the current growth performance of a state can give an indication of its potential position in the future. Is the rise in rankings of states like Maharashtra and Gujarat also matched by a faster growth rate on their part? Also, are there states that are lower down in the ranking but are growing faster than average and so can hope to improve their ranking in the future?
Table 2 documents the annual average growth rates of states which have performed better than national average (leaders) in each of the three decades. Only three states have had above average growth performance in all three decades: Gujarat, Tamil Nadu and Maharashtra. They were joined by Andhra Pradesh, Bihar, Haryana and Kerala in the 2000s.
Interestingly, the growth rate of Punjab, initially one of the top-ranked states in terms of per capita income level, has been below the national average in the last two decades. Thus it is not surprising that it is slipping down in rank below other faster-growing states. Bihar, on the other hand, is poised to rise up the ranks with a higher than average growth rate of per capita income in the 2000s. In a way, Bihar’s story is the opposite of Punjab’s: while it is still at the bottom of the chart in terms of the level of per capita income, it can expect to improve its rank if it maintains its recent high growth rate.
Now we come to one of the key questions. Which are the states that improved their performance in the 2000s both with respect to their past performance in the earlier two decades, and with respect to the performance of other states in the 2000s? Table 3 graphically plots the average annual growth rates of five states against the national average over time. This graph shows an interesting trend: while Gujarat, Tamil Nadu and Maharashtra have been going neck and neck (and Haryana, which is not shown in the figure), and as already mentioned, have consistently performed above the national average, none of them has experienced a huge acceleration in growth rate in the 2000s. In contrast, Bihar, which was consistently doing worse than the national average through the ’80s and ’90s, shot up above the national average in the 2000s, converging to rates achieved by established leaders like Gujarat, Maharashtra and Tamil Nadu.
To sum up, we see that Maharashtra, Haryana, Punjab, Gujarat and Tamil Nadu have been among the richest states in the last three decades. In the 2000s, the big news was Punjab dropping from the top 5 and Kerala breaking into this select group. Among the rest, Maharashtra ended as the topper in the latter half of the 2000s, and Gujarat at a very respectable number 3, after Haryana. In terms of growth performance, Gujarat, Tamil Nadu and Maharashtra were the toppers over the last three decades but in the 2000s, three other states raised their game to join the list of fastest-growing states: Bihar, Haryana and Andhra Pradesh. However, if any state could claim that its performance relative to the rest of India actually improved in the 2000s, that state is Bihar.
Therefore, if awards must be given, Bihar deserves the prize for the most dramatic turnaround in the 2000s. Gujarat gets credit for having steadily been on top of the league in terms of both the level of per capita income and its growth rate, but has to share the honours with Maharashtra and Haryana in that category. However, there is no evidence of any significant growth acceleration in Gujarat in the 2000s.
One could argue that it is easier to turn around a state that was at the bottom of the league like Bihar than to maintain, or to marginally improve, the performance of a state already at the top of the league, like Maharashtra, Haryana or Gujarat. After all, there is greater scope for improvement in the former case. Conversely, one could also argue that it is more challenging to turn around a backward state, because if it were easy, someone would have done it already. This is reinforced by the argument that Bihar is the third largest state, whereas Gujarat’s rank is 10th in terms of population, and it is difficult to achieve sharp improvements in a larger than a smaller state.
Be that as it may, many would argue that per capita income and its growth—the indices we have considered so far—are only partial measures of economic development. Among other things, these indices ignore aspects of development that are not captured in income, for example, life expectancy or education. Nor do these take into account income inequality or the extent of poverty. Therefore, we now turn our attention to the performance of the states in terms of the Human Development Index (HDI), level of inequality and the percentage of people below the poverty line.
Table 4 highlights HDI scores of the seven states with HDI scores above the national average over the last three decades. These are Kerala, Punjab, Maharashtra, Haryana, Tamil Nadu, Gujarat and Karnataka. Table 5, on the other hand, plots the performance of some selected states with respect to the all-India average in terms of HDI. As we would expect, Kerala’s performance is literally off the charts. Maharashtra, Tamil Nadu and Gujarat, on the other hand, appear to have been going head to head. Their trends tell an interesting story. While Gujarat’s HDI performance was above the national average in the ’80s and ’90s, it decelerated in the 2000s and came down to the national average. In contrast, Tamil Nadu and Maharashtra, which started off at a similar level of HDI as Gujarat in the ’80s, have continued to perform better than the national average in the 2000s. Bihar, on the other hand, has consistently been below the national average, but it has made significant improvements over the last decade and shows signs of catching up to the national average.Thus, the HDI rankings of states present a different story than their rankings of per capita income levels or growth rates, with one exception. The only state that is in the top 3 in all the rankings so far is Maharashtra. Otherwise, the top prize for HDI goes to Kerala, and “the most improved in the 2000s” prize goes to Bihar.
Next, we look at a few states’ ranking in terms of level of inequality (see Table 6) based on consumption expenditure. Assam and Bihar have consistently had the lowest levels of inequality according to this index. However, the state that really stands out, both in terms of relative ranking and absolute decline in inequality, is Rajasthan. Between the early ’80s and late 2000s, Rajasthan’s relative ranking improved from 15th to third, while its inequality measure fell by 14 per cent, the largest decline for any state. On the contrary, states that are leaders on the growth dimension are found to perform worse on inequality. For example, it’s evident from Table 7 that while inequality in Gujarat was lower than the national average in the ’80s and ’90s, it actually rose to levels above the national average in the 2000s. Maharashtra, Tamil Nadu and Kerala, too, have consistently recorded higher levels of inequality than the rest of India, with Kerala showing a sharp spike in the 2000s.
Lastly, we consider the percentage of population below the poverty line (see Table 8). We find that Himachal Pradesh, Punjab, Kerala, Gujarat, Haryana, Andhra Pradesh and Karnataka have consistently had lower levels of poverty than the all-India average. Gujarat’s performance in poverty reduction over the years has been similar to that of Andhra Pradesh and Kerala. However, if we look at improvements in performance over the last decade, then Tamil Nadu is one of the top performers. Starting from a level of poverty that was higher than the national average in 1983, it ended up at a much lower level, similar to those of Gujarat, AP and Kerala, in 2009 (see Table 9). Bihar, although well above the national average in terms of poverty levels all through the three decades, has shown a sharp improvement over the last decade.
Is there, then, a clear answer to the question we had started with: did Gujarat truly outshine other
states in the 2000s in terms of economic development? If we simply look at the figures, four facts will jump out: first, Bihar has improved the most in the 2000s, even though it has been at the bottom of the list for all indicators and still has a fair distance to go before it can go above the national average; second, Kerala has far outpaced other states in terms of HDI all through; third, Rajasthan was the star performer in terms of reducing inequality; and fourth, Maharashtra and Gujarat have consistently been top performers in terms of per capita income and its growth, with Haryana and Tamil Nadu deserving mention too. All these achievements are noteworthy but it is hard to single out any state as the top performer in the 2000s.To the extent this assessment goes against the view held by many people independent of their political leanings that Gujarat has done spectacularly well under Mr Modi, the explanation lies in our ‘differences in differences’ approach.
In particular, this is what we tried to figure out: did a state that has for a long time been one of the most developed states in terms of per capita income, and was already improving at a rate higher than the rest of the country, accelerate further and significantly increase its growth margin under Modi’s stewardship? Our analysis shows that this did not happen. Both Maharashtra and Gujarat improved upon an already impressive growth trajectory in the 2000s, but the margin of improvement was too small to be statistically meaningful. So while Gujarat’s overall record is undoubtedly very good all through the last three decades, its performance in the 2000s does not seem to justify the wild euphoria and exuberant optimism about Modi’s economic leadership.
Of course, it is possible that there are trends that this evidence cannot capture. Maybe with a longer time horizon, the effects of some of Modi’s policies will show up in the evidence, although given that he is now in his fourth consecutive term of power, this argument is not very strong. It is also possible that if Modi comes to power at the Centre, he may well achieve a turnaround of the Indian economy due to his governance style. All that is possible in theory, but the existing evidence is insufficient to support these views.
As John Maynard Keynes had famously said in the context of stockmarket bubbles, often our decisions to do something, the full consequences of which will be drawn out over many days to come, can only be “taken as the result of animal spirits”—a spontaneous urge to action rather than inaction or rational calculation. In politics, too, maybe it is animal spirits that rule, not rational calculations based on statistical evidence. However, while election campaigns are run on slogans and sentiments, good governance depends on facts and figures. Bubbles eventually burst, waves of euphoria recede. At some point, the numbers need to add up.
By Maitreesh Ghatak and Sanchari Roy
(Maitreesh Ghatak is Professor of Economics at the London School of Economics; Sanchari Roy is a research associate at the Department of Economics, University of Warwick, UK.)
Subscribe to:
Posts (Atom)