December 5, 2011
Posted by Anantha Narayanan 1 hour, 10 minutes ago in Tests - bowling
Five-wicket hauls in Tests: a look across and deep - part one
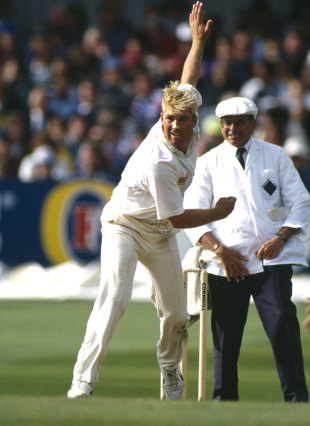
 Michael Holding: 14 wickets on a flat track at The Oval in 1976
© Getty Images
Michael Holding: 14 wickets on a flat track at The Oval in 1976
© Getty Images
There is a tendency to ignore the bowlers in Test cricket. I myself am
guilty of this and do not allocate equal time and effort for these
forgotten species. This time I have decided to make amends by doing the
article on fifers in Test cricket immediately after I finished the one
on Test hundreds.
First, the term used. Let me reproduce the Wikipedia entry below.
Five-wicket haul (also Five-for, five-fer, fifer, or shortened to 5WI or FWI)
Five or more wickets taken by a bowler in an innings, considered a very
good performance. The term fifer is an abbreviation of the usual form of
writing bowling statistics, e.g. a bowler who takes 5 wickets and
concedes 117 runs is said to have figures of "5 for 117" or "5-117".
Sometimes called a "Michelle", after actress Michelle Pfeiffer.
I like the term "Fifer". However since that also refers to the
foot-soldier who plays the "Fife", the Scottish flute, I am somewhat
reluctant. "Pfeiffer" would be injudicious. I am not too comfortable
with "Five-for", being slightly contrived and seemingly incomplete. So I
will stick with "fifer", a single non-hyphenated (!!!) word and my
favourite. Much better than "DLF maximum" or "Karbonn Kamaal Katch".
Some maxims have to be repeated in EVERY article since quite a few
readers have a one-track mind and see what only they want to see.
This is not a Bowling Ratings article.
The ordering is based on an indicated measure and is visible to the
reader clearly. Do not draw any unintended inferences and come out with
comments based on those. There is no personal discretion involved other
than setting up the parameters. In view of the size of the articles and
number of tables, I have kept my narratives to a minimum.
Test Bowling is a fascinating subject. It is far more nuanced that Batting when it comes to analysis.
- The number of wickets in an innings is strictly limited to 10.
- Bowling successes are very clearly defined and measurable in terms of wickets (who and when) and accuracy.
- Bowling is three-dimensional: balls, runs and wickets. These three dimension-related values are available for
all bowling spells. (Batting is also three-dimensional: runs, time, balls. Unfortunately only runs information is available for all matches.)
- Batsmen win and save matches. Bowlers, almost always, win matches.
They rarely draw matches, a la Atherton, Hanif et al. But you will be
surprised: wait for the next article !!! A great ODI team can be founded
on top-class batting and average bowling, not a great Test team.
- 5 batsmen can score hundreds in an innings, and have done so. Only two bowlers can capture 5 wickets each in an innings.
All these nuances lead to a more exciting analysis of fifers.
It took me nearly a week to think of all possibilities, write the
program, prepare the tables and then weave the article around the
tables. I did so much work on the keyboard that my legs (yes, you read
it correctly) started aching. This turned out to be the longest article I
had ever done, barring none. So I decided to release this in two parts.
This will also enable me to do some specialized requests and add those
tables. At the end of the article, I have indicated the types of
analysis which have been included in Part 2. Even now, the current
article has been exceeded in size by only one article, the one published
last, on Special hundreds.
A note on the tables. I have standardized the presentation to have the
first 14 columns common. These are self-explanatory. I have shown
Home/Away (H/A), Bowling Type (S for spinners), innings bowled in and
Result (W for Win, = for draw and * for loss).
First the basic table. I did not do this for the hundreds. However it is
necessary to start with this table in the bowling analysis since many
readers may not be familiar with all these performances.
1. 9+ wicket bowling performances in Tests
MtId Year For Vs  Score HA Bowler          BT I <--Analysis--> R

0428 1956 Eng Aus-205/10 H Laker J.C        S 3 51.2-23- 53-10 W
1443 1999 Ind Pak-207/10 H Kumble A         S 4 26.3- 9- 74-10 W
0048 1896 Eng Saf-151/10 A Lohmann G.A        2 12.0- 6- 28- 9 W
0428 1956 Eng Aus- 84/10 H Laker J.C        S 2 16.4- 4- 37- 9 W
1583 2002 Slk Zim-236/10 H Muralitharan M   S 1 40.0-19- 51- 9 W
1029 1985 Nzl Aus-179/10 A Hadlee R.J         1 23.4- 4- 52- 9 W
1081 1987 Pak Eng-175/10 H Abdul Qadir      S 1 37.0-13- 56- 9 W
1266 1994 Eng Saf-175/10 H Malcolm D.E        3 16.3- 2- 57- 9 W
1423 1998 Slk Eng-181/10 A Muralitharan M   S 3 54.2-27- 65- 9 W
0483 1959 Ind Aus-219/10 H Patel J.M        S 2 35.5-16- 69- 9 W
0967 1983 Ind Win-201/10 H Kapil Dev N        3 30.3- 6- 83- 9 *
0849 1979 Pak Aus-310/10 A Sarfraz Nawaz      4 47.2- 7- 86- 9 W
0683 1971 Win Ind-352/10 H Noreiga J.M      S 2 49.4-16- 95- 9 *
0461 1958 Ind Win-222/10 H Gupte S.P        S 1 34.3-11-102- 9 *
0131 1913 Eng Saf-231/10 A Barnes S.F         3 38.4- 7-103- 9 W
0437 1957 Saf Eng-214/10 H Tayfield H.J     S 4 49.2-11-113- 9 W
0138 1921 Aus Eng-315/10 H Mailey A.A       S 3 47.0- 8-121- 9 W
I have limited this to bowling spells in which the bowler captured 9 or
more wickets. Only twice have bowlers captured all 10 wickets. Jim
Laker's feat came 79 years and 427 Tests after Alfred Shaw bowled the
first ball to Charles Bannerman. Anil Kumble's feat came a further 1015
Tests and 43 years after Laker dismissed Len Maddocks. I wonder how many
years would pass before this happens again: let me say, around 2050.
Laker had another 9-wicket haul,
in the same match. Muttiah
Muralitharan is the only other bowler to capture 9-wkts in an innings
twice. Quite surprisingly, the three spinners, Muralitharan, Abdul Qadir
and Subhash Gupte, captured 9 wickets on the first day. Another
wonderful spinner, Hugh Tayfield's 9 for 113 was adjudged to be the best
ever bowling performance in the Wisden-100 analysis. More of this
performance later. Kapil Dev, Gupte and Jack Noreiga all captured
9-wickets in an innings, in vain. Surely let us all agree that no one, I
repeat no one, in the next 1000 years, if Test cricket survives that
far, would capture all 20 wickets in a match.
Now for something I think is very important, performance away from home.
2. Wonderful performances, away from home
MtId Year For Vs  Score HA Bowler          BT I <--Analysis--> R

0048 1896 Eng Saf-151/10 A Lohmann G.A        2 12.0- 6- 28- 9 W
1029 1985 Nzl Aus-179/10 A Hadlee R.J         1 23.4- 4- 52- 9 W
1423 1998 Slk Eng-181/10 A Muralitharan M   S 3 54.2-27- 65- 9 W
0849 1979 Pak Aus-310/10 A Sarfraz Nawaz      4 47.2- 7- 86- 9 W
0131 1913 Eng Saf-231/10 A Barnes S.F         3 38.4- 7-103- 9 W
0047 1896 Eng Saf- 30/10 A Lohmann G.A        4  8.1- 5-  7- 8 W
0032 1889 Eng Saf- 43/10 A Briggs J         S 3  9.4- 5- 11- 8 W
0104 1909 Aus Eng-119/10 A Laver F            2 18.2- 7- 31- 8 =
0026 1887 Eng Aus- 84/10 A Lohmann G.A        2 16.4-12- 35- 8 W
1370 1997 Aus Eng- 77/10 A McGrath G.D        1 20.3- 8- 38- 8 =
1398 1998 Eng Win-191/10 A Fraser A.R.C       2 16.1- 2- 53- 8 *
0699 1972 Aus Eng-116/10 A Massie R.A.L       3 27.2- 9- 53- 8 W
0131 1913 Eng Saf-160/10 A Barnes S.F         1 26.5- 9- 56- 8 W
0036 1892 Eng Aus-145/10 A Lohmann G.A        1 43.2-18- 58- 8 *
1341 1996 Saf Ind-137/10 A Klusener L         4 21.3- 4- 64- 8 W
0074 1902 Aus Eng-183/10 A Trumble H        S 2 31.0-13- 65- 8 *
0079 1904 Eng Aus-111/10 A Rhodes W         S 4 15.0- 0- 68- 8 W
0863 1979 Pak Ind-126/10 A Sikander Bakht     2 21.0- 3- 69- 8 =
1804 2006 Slk Eng-190/10 A Muralitharan M   S 4 30.0-11- 70- 8 W
1307 1995 Saf Zim-283/10 A Donald A.A         3 33.0-12- 71- 8 W
1258 1994 Eng Win-304/10 A Fraser A.R.C       2 28.5- 7- 75- 8 W
0769 1976 Ind Nzl-215/10 A Prasanna E.A.S   S 3 30.4- 5- 76- 8 W
0082 1904 Eng Aus-247/10 A Braund L.C       S 1 29.1- 6- 81- 8 *
1027 1985 Slk Pak-259/10 A Ratnayeke J.R      2 23.2- 5- 83- 8 *
0699 1972 Aus Eng-272/10 A Massie R.A.L       1 32.5- 7- 84- 8 W
0947 1983 Ind Pak-323/10 A Kapil Dev N        1 30.5- 7- 85- 8 =
0738 1974 Eng Win-305/10 A Greig A.W          2 36.1-10- 86- 8 W
0781 1976 Win Eng-435/10 A Holding M.A        2 33.0- 9- 92- 8 W
0057 1898 Eng Aus-239/10 A Richardson T       2 36.1- 7- 94- 8 *
0323 1950 Win Eng-312/10 A Valentine A.L    S 1 50.0-14-104- 8 *
1032 1985 Ind Aus-381/10 A Kapil Dev N        1 38.0- 6-106- 8 =
1797 2006 Aus Bng-427/10 A MacGill S.C.G    S 1 33.3- 2-108- 8 W
0179 1929 Eng Aus-336/10 A White J.C        S 4 64.5-21-126- 8 W
1020 1985 Aus Eng-482/ 9 A McDermott C.J      2 36.0- 3-141- 8 =
1680 2004 Ind Aus-474/10 A Kumble A         S 2 46.5- 7-141- 8 =
1892 2008 Aus Ind-441/10 A Krejza J.J         1 43.5- 1-215- 8 *
In view of the importance of this classification, I have lowered the
cut-off to 8 wicket captures at the risk of going beyond my self-imposed
limit of 25 table entries. The table is ordered by the bowling
performance.
George Lohmann, on those uncovered pitches of yonder, crossed 8 wickets
mark no fewer than four times. Quite a few achieved this twice. Barnes,
Fraser, Kapil Dev, Massie (in the same match) and Muralitharan. The
9-wicket captures of Hadlee, Muralitharan and Sarfraz Nawaz are probably
the pick of the lot, all resulting in winning matches. Sarfraz, to
boot, in the last innings. The last time this was done, was by an
off-spinner on a baptism debut of fire in India.
Now for some special selections. The bowlers who captured the top-six batsmen.
3. Bowling spells in which top six wickets are captured - 1
MtId Year For Vs  Score HA Bowler          BT I <--Analysis--> R BA-T Avge

0235 1934 Aus Eng-627/ 9 A O'Reilly W.J     S 1 59.0- 9-189- 7 = 297  49.5
0461 1958 Ind Win-222/10 H Gupte S.P        S 1 34.3-11-102- 9 * 262  43.7
1804 2006 Slk Eng-190/10 A Muralitharan M   S 4 30.0-11- 70- 8 W 258  43.1
0990 1984 Eng Win-245/10 H Botham I.T         2 27.4- 6-103- 8 * 256  42.6
0754 1975 Eng Aus-304/10 A Underwood D.L    S 1 38.4- 3-113- 7 * 254  42.3
1110 1988 Aus Win-349/ 9 H Hughes M.G         3 37.0- 9- 87- 8 * 254  42.3
1443 1999 Ind Pak-207/10 H Kumble A         S 4 26.3- 9- 74-10 W 250  41.7
0913 1981 Aus Pak-500/ 8 H Yardley B        S 1 66.0-16-187- 7 * 248  41.3
1726 2004 Aus Pak- 72/10 H McGrath G.D        4 16.0- 8- 24- 8 W 244  40.7
1028 1985 Slk Pak-295/10 A de Mel A.L.F       2 22.0- 1-109- 6 * 240  40.0
0765 1975 Win Aus-169/10 A Roberts A.M.E      3 18.4- 3- 54- 7 W 235  39.2
1029 1985 Nzl Aus-179/10 A Hadlee R.J         1 23.4- 4- 52- 9 W 234  39.0
1513 2000 Pak Eng-480/ 8 H Saqlain Mushtaq  S 1 74.0-20-164- 8 = 234  39.0
1377 1997 Aus Eng-180/10 A McGrath G.D        1 21.0- 4- 76- 7 * 221  36.8
0428 1956 Eng Aus-205/10 H Laker J.C        S 3 51.2-23- 53-10 W 213  35.4
0975 1984 Nzl Eng-463/10 H Cairns B.L         2 45.0-10-143- 7 = 212  35.4
0788 1976 Eng Ind-122/10 A Lever J.K          2 23.0- 6- 46- 7 W 207  34.5
0083 1905 Eng Aus-188/10 H Bosanquet B.J.T  S 4 32.4- 2-107- 8 W 197  32.8
1525 2000 Aus Win-109/10 H Gillespie J.N      4 17.0- 5- 40- 6 W 189  31.4
0323 1950 Win Eng-312/10 A Valentine A.L    S 1 50.0-14-104- 8 * 185  30.8
1583 2002 Slk Zim-236/10 H Muralitharan M   S 1 40.0-19- 51- 9 W 180  30.0
1878 2008 Eng Nzl-123/10 H Anderson J.M       2 21.3- 8- 43- 7 W 165  27.6
0131 1913 Eng Saf-160/10 A Barnes S.F         1 26.5- 9- 56- 8 W 157  26.2
0424 1956 Win Nzl-157/ 9 A Atkinson D.S.t.E S 3 40.0-21- 53- 7 * 145  24.1
0039 1893 Eng Aus-269/10 H Lockwood W.H       2 37.3-11-101- 6 = 133  22.2
This table is ordered by the average of the batting averages of the six
batsmen dismissed. O'Reilly dismissed Walters, Sutcliffe, Wyatt,
Hammond, Hendren and Leyland, two of these on either side of 60.0. An
imposing collection indeed. Gupte accounted for Holt, Hunte, Sobers,
Kanhai, OG Smith and Butcher. Muralitharan dismissed Trescothick,
Strauss, Cook, Pietersen, Collingwood and Flintoff.
One cannot keep these two greats out. Muralitharan and McGrath are the
only bowlers to do this twice in their career. Now for another view of
the same group.
4. Bowling spells in which top six wickets are captured - 2
MtId Year For Vs  Score HA Bowler          BT I <--Analysis--> R Runs

1525 2000 Aus Win-109/10 H Gillespie J.N      4 17.0- 5- 40- 6 W  14
1726 2004 Aus Pak- 72/10 H McGrath G.D        4 16.0- 8- 24- 8 W  55
0131 1913 Eng Saf-160/10 A Barnes S.F         1 26.5- 9- 56- 8 W  73
0461 1958 Ind Win-222/10 H Gupte S.P        S 1 34.3-11-102- 9 *  86
1878 2008 Eng Nzl-123/10 H Anderson J.M       2 21.3- 8- 43- 7 W  86
0788 1976 Eng Ind-122/10 A Lever J.K          2 23.0- 6- 46- 7 W  94
0424 1956 Win Nzl-157/ 9 A Atkinson D.S.t.E S 3 40.0-21- 53- 7 *  95
1804 2006 Slk Eng-190/10 A Muralitharan M   S 4 30.0-11- 70- 8 W 106
0323 1950 Win Eng-312/10 A Valentine A.L    S 1 50.0-14-104- 8 * 110
0765 1975 Win Aus-169/10 A Roberts A.M.E      3 18.4- 3- 54- 7 W 115
1377 1997 Aus Eng-180/10 A McGrath G.D        1 21.0- 4- 76- 7 * 115
0039 1893 Eng Aus-269/10 H Lockwood W.H       2 37.3-11-101- 6 = 119
1443 1999 Ind Pak-207/10 H Kumble A         S 4 26.3- 9- 74-10 W 119
0754 1975 Eng Aus-304/10 A Underwood D.L    S 1 38.4- 3-113- 7 * 122
1583 2002 Slk Zim-236/10 H Muralitharan M   S 1 40.0-19- 51- 9 W 130
0083 1905 Eng Aus-188/10 H Bosanquet B.J.T  S 4 32.4- 2-107- 8 W 137
0990 1984 Eng Win-245/10 H Botham I.T         2 27.4- 6-103- 8 * 142
1029 1985 Nzl Aus-179/10 A Hadlee R.J         1 23.4- 4- 52- 9 W 144
1028 1985 Slk Pak-295/10 A de Mel A.L.F       2 22.0- 1-109- 6 * 156
0428 1956 Eng Aus-205/10 H Laker J.C        S 3 51.2-23- 53-10 W 160
0975 1984 Nzl Eng-463/10 H Cairns B.L         2 45.0-10-143- 7 = 239
1110 1988 Aus Win-349/ 9 H Hughes M.G         3 37.0- 9- 87- 8 * 247
1513 2000 Pak Eng-480/ 8 H Saqlain Mushtaq  S 1 74.0-20-164- 8 = 288
0913 1981 Aus Pak-500/ 8 H Yardley B        S 1 66.0-16-187- 7 * 388
0235 1934 Aus Eng-627/ 9 A O'Reilly W.J     S 1 59.0- 9-189- 7 = 404
This table has been ordered by the aggregate of runs scored by the top
six batsmen dismissed by the bowler. This is an indication of the mayhem
which was caused by the bowler.
Gillespie's decimation of the West Indian top order, including Brian
Lara, reads like this: 6, 0, 4, 0, 4, 0. Looks like a telephone number
or a T20 over. See how far ahead Gillespie is of McGrath, whose numbers
are 9, 1, 17, 27, 1, 0. Spare a thought for O'Reilly, who was first in
the previous classification and is now last. The top six English batsmen
scored 52, 63, 0, 4, 132, 153.
Now the bowlers who out-performed their compatriots hundreds of times, okay by more than 12.5 times.
5. Bowling out-performers: many times the rest of the team
MtId Year For Vs  Score HA Bowler          BT I <--Analysis--> R BAvg TAvg Ratio

1630 2002 Win Bng- 87/10 A Lawson J.J.C       3  6.5- 4-  3- 6 W  0.5  18.2 36.5
1720 2004 Aus Ind-205/10 A Clarke M.J       S 3  6.2- 0-  9- 6 *  1.5  48.0 32.0
0290 1947 Aus Ind- 58/10 H Toshack E.R.H      2  3.1- 1-  2- 5 W  0.4  10.8 27.0
0799 1977 Win Pak-180/10 H Croft C.E.H        1 18.5- 7- 29- 8 W  3.6  68.0 18.8
0348 1952 Ind Eng-266/10 H Mankad M.H       S 1 38.5-15- 55- 8 W  6.9 100.0 14.5
0527 1962 Win Ind-187/10 H Gibbs L.R        S 3 53.3-37- 38- 8 W  4.8  67.5 14.2
1210 1993 Aus Win-146/10 H May T.B.A        S 3  6.5- 3-  9- 5 *  1.8  24.6 13.7
0294 1948 Aus Ind-277/10 H Lindwall R.R       3 22.1- 4- 38- 7 W  5.4  72.3 13.3
1899 2008 Aus Saf-281/10 H Johnson M.G        2 24.0- 4- 61- 8 *  7.6 101.5 13.3
0781 1976 Win Eng-435/10 A Holding M.A        2 33.0- 9- 92- 8 W 11.5 151.5 13.2
0047 1896 Eng Saf- 30/10 A Lohmann G.A        4  8.1- 5-  7- 8 W  0.9  11.5 13.1
0823 1978 Win Aus-290/10 H Holder V.A         2 13.0- 4- 28- 6 W  4.7  61.2 13.1
1275 1994 Aus Eng-323/10 H Warne S.K        S 4 50.2-22- 71- 8 W  8.9 113.0 12.7
0129 1912 Aus Eng-175/10 A Hazlitt G.R      S 3 21.4- 8- 25- 7 *  3.6  45.0 12.6
0743 1974 Eng Pak-226/10 H Underwood D.L    S 3 34.5-17- 51- 8 =  6.4  80.0 12.5
Jermaine Lawson's 6 for 3 had an average of 0.5. His fellow bowlers
captured 4 for 73 and the out-performance ratio is a whopping 36.5.
Clarke's equally amazing 6 for 9 had an out-performer ratio of 32.0 and
Ernie Toshack's unbelievable spell of 5 for 2 against India, ended with a
ratio of 27.0. These three are bizarre performances.
Colin Croft's is a genuine case of out-performance. 8 for 29 against 2
for 136, resulting in a ratio of 18.8. Mankad, the peerless Indian
all-rounder captured 8 for 55 against 2 for 200. Shane Warne's 8 for 71
against 2 for 226 is an all-time classic. One would have expected
Muralitharan present in this table. However he appears quite a few times
in earlier tables but not in this one.
Next is an important variation of the top order wicket captures.
6. Based on difference between batting average and runs scored
MtId Year For Vs  Score HA Bowler          BT I <--Analysis--> R T7W Diff Avg

1906 2009 Win Eng- 51/10 H Taylor J.E         3  9.0- 4- 11- 5 W  5  216 43.3
1756 2005 Aus Eng-155/10 A McGrath G.D        2 18.0- 5- 53- 5 W  5  193 38.6
1971 2010 Pak Eng-446/10 A Mohammad Aamer     1 28.0- 6- 84- 6 *  5  190 38.0
1974 2010 Nzl Ind-266/10 A Martin C.S         3 27.0- 8- 63- 5 =  5  190 38.0
2016 2011 Aus Saf- 96/10 A Watson S.R         2  5.0- 2- 17- 5 *  5  183 36.6
1931 2009 Eng Aus-160/10 H Broad S.C.J        2 12.0- 1- 37- 5 W  5  179 35.8
0652 1969 Nzl Win-417/10 H Motz R.C           1 36.0- 3-113- 5 =  5  177 35.3
1615 2002 Pak Aus-127/10 A Shoaib Akhtar      3  8.0- 2- 21- 5 *  4  181 45.3
0755 1975 Eng Aus-152/10 A Lever P            1 14.4- 2- 38- 6 W  4  175 43.8
1278 1994 Win Ind-114/10 A Benjamin K.C.G     4 17.0- 3- 65- 5 W  4  171 42.8
1104 1988 Pak Aus-165/10 H Iqbal Qasim      S 2 39.0-24- 35- 5 W  4  166 41.6
0303 1948 Eng Aus-389/10 H Hollies W.E      S 2 56.0-14-131- 5 *  4  165 41.3
0255 1936 Eng Aus- 58/10 A Allen G.O.B        4  8.0- 0- 36- 5 W  4  164 41.0
1823 2006 Ind Saf- 84/10 A Sreesanth S        2 10.0- 3- 40- 5 W  4  163 40.7
This is based on the dismissals of top-7 batsmen. The bowlers who
captured at least 4 wickets are considered. For each such bowler, I have
compiled the sum of the difference between the batting average and the
runs scored by the batsman. This has been averaged and we get the
notional runs saved. This table lists the bowlers whose average runs
saved value is greater than 35/40 depending on whether the bowler
captured 5/4 wickets.
Jerome Taylor's once-in-a-lifetime effort of 5 for 15 is on top. He
dismissed Strauss (9), Cook (0), Pietersen (1), Collingwood (1) and
Prior (0). The total batting average of these five batsmen was 227.5 and
the saved runs average worked out to 43.3.
McGrath captured the wickets of Trescothick (4), Strauss (2), Vaughan
(3), Bell (6) and Flintoff (0). The total of batting averages for these
five comes to 208, leading to a runs saved value of 38.6. Shoaib Akhtar
dismissed Ponting (7), M.Waugh( (0), S.Waugh (0) and Gilchrist (5). The
total batting average was 192.5, leading to a runs saved value of 45.3.
Shoaib Akhtar's and McGrath's performances were also away.
Martin's was during the 15 for 5 debacle of India and Watson's was on that manic November Thursday at Newlands.
Let us now look at bowling performances in bat-fests. The match RpW value here applies to the top-7 batsmen only.
7. Bowling performances in matches with high RpW values: > 50.0
MtId Year For Vs  Score HA Bowler          BT I <--Analysis--> R MatRpW

0781 1976 Win Eng-435/10 A Holding M.A        2 33.0- 9- 92- 8 W  50.2
1680 2004 Ind Aus-474/10 A Kumble A         S 2 46.5- 7-141- 8 =  60.2
0416 1955 Ind Nzl-326/10 H Gupte S.P        S 2 76.4-35-128- 7 =  54.5
0564 1964 Aus Eng-611/10 A McKenzie G.D       2 60.0-15-153- 7 =  66.9
0235 1934 Aus Eng-627/ 9 A O'Reilly W.J     S 1 59.0- 9-189- 7 =  54.5
1981 2010 Aus Eng-260/10 H Siddle P.M       S 1 16.0- 3- 54- 6 =  52.5
0781 1976 Win Eng-203/10 A Holding M.A        4 20.4- 6- 57- 6 W  50.2
0404 1955 Aus Win-382/10 A Lindwall R.R       1 24.5- 3- 95- 6 =  52.3
1981 2010 Eng Aus-481/10 A Finn S.T           2 33.4- 1-125- 6 =  52.5
1831 2007 Eng Win-437/10 H Panesar M.S      S 2 36.1- 3-129- 6 =  50.5
1810 2006 Slk Saf-434/10 H Muralitharan M   S 3 64.0-11-131- 6 W  52.3
1912 2009 Pak Slk-606/10 H Umar Gul           1 37.0- 2-135- 6 =  59.7
0450 1958 Win Pak-328/10 H Atkinson E.S.t.E   1 21.0- 7- 42- 5 W  56.2
0274 1939 Win Eng-352/10 A Constantine L.N    1 23.1- 2- 75- 5 =  50.7
1681 2004 Saf Win-427/10 H Nel A              2 28.1- 8- 87- 5 =  53.2
1816 2006 Win Pak-357/10 A Taylor J.E         1 26.0- 6- 91- 5 =  50.3
1303 1995 Win Eng-454/10 A Ambrose C.E.L      1 42.0-10- 96- 5 =  59.5
1034 1986 Ind Aus-396/10 A Yadav N.S        S 2 62.3-21- 99- 5 =  53.1
0271 1939 Eng Saf-530/10 A Perks R.T.D        1 54.4- 5-100- 5 =  56.6
1891 2008 Ind Aus-577/10 H Sehwag V         S 2 40.0- 9-104- 5 =  52.9
1148 1990 Eng Ind-454/10 H Fraser A.R.C       2 39.1- 9-104- 5 W  51.7
1614 2002 Ind Eng-515/10 A Harbhajan Singh  S 1 38.4- 6-115- 5 =  51.7
0744 1974 Pak Eng-545/10 A Intikhab Alam    S 2 51.4-14-116- 5 =  53.9
1850 2007 Ind Pak-456/10 H Harbhajan Singh  S 2 45.5- 9-122- 5 =  54.4
1911 2009 Eng Win-749/ 9 A Swann G.P          2 50.4- 8-165- 5 =  81.4
These are heart-breakers. However most of these performances have been
in drawn matches, as the qualification criteria suggests. The stand-out
performance is Michael Holding's 8 for 92 and 6 for 57 on an Oval
shirt-front pitch, possibly the greatest match bowling performance ever.
He, almost certainly more than Viv Richards, was responsible for the
fine West Indian win. Harbhajan Singh has held his own on the flat
wickets twice, the only bowler to do so, other than Holding. Virender
Sehwag is an unlikely name in this table.
Now for a unique table. I would not spoil the fun. Pl see the table.
8. They captured 5 and only 5 wickets: but nos 7 to 11
MtId Year For Vs  Score HA Bowler          BT I <--Analysis--> R

1508 2000 Eng Win- 61/10 H Caddick A.R        3 11.2- 5- 14- 5 W
1432 1998 Pak Zim-183/10 H Saqlain Mushtaq  S 1 13.5- 3- 32- 5 =
1431 1998 Aus Eng-191/10 H Gillespie J.N      3 15.2- 2- 88- 5 W
0949 1983 Win Ind-174/10 H Roberts A.M.E      3 24.3- 9- 39- 5 W
0608 1966 Win Eng-240/10 A Sobers G.St.A      2 19.3- 4- 41- 5 W
Other fifers
1755 2005 Slk Win-113/10 H Muralitharan M   S 3 21.0- 8- 36- 6 W
1504 2000 Slk Saf-269/10 H Muralitharan M   S 3 35.0- 5- 84- 7 W
1423 1998 Slk Eng-445/10 A Muralitharan M   S 1 59.3-14-155- 7 W
1175 1991 Eng Win-176/10 H Tufnell P.C.R    S 2 14.3- 3- 25- 6 W
1058 1986 Pak Win-211/10 H Imran Khan         3 22.3- 2- 46- 6 =
1040 1986 Nzl Aus-103/10 H Bracewell J.G    S 3 22.0- 8- 32- 6 W
0986 1984 Aus Win-509/10 A Hogg R.M           2 32.4- 4- 77- 6 *
0947 1983 Ind Pak-323/10 A Kapil Dev N        1 30.5- 7- 85- 8 =
0877 1980 Win Nzl-305/10 A Garner J           2 36.2-15- 56- 6 =
0725 1973 Win Eng-255/10 A Boyce K.D          4 21.1- 4- 77- 6 W
0703 1972 Ind Eng-200/10 H Chandrasekhar B. S 2 41.5-18- 79- 8 *
0463 1959 Win Ind-154/10 A Gilchrist R        3 21.0- 7- 55- 6 W
0436 1957 Saf Eng-254/10 H Tayfield H.J     S 3 50.3-14- 69- 8 =
0250 1936 Aus Saf- 98/10 A Grimmett C.V     S 3 19.5- 9- 40- 7 W
0075 1902 Saf Aus-296/10 H Llewellyn C.B      2 22.0- 3- 92- 6 =
These bowlers captured fifers, no doubt. But they also captured the LAST
five wickets. And, to boot, these were the ONLY 5 wickets captured by
the first five them. Don't think it is easy to do that. Some other
bowler could spoil the fun. One batsman could remain not out. Everything
has to work. This leaves us with just 5 bowlers, almost all of recent
vintage. It is ironic that Gillespie appears at the top of the top-6
wickets list and also here.
If I did not have the ONLY 5 wickets criteria, there are quite a few, 20
in all, who fit in. However these other 13 bowlers have had the
satisfaction of capturing one or more top order wickets. Muralitharan
appears thrice here indicating the way he dominated the late order
batting.
Now for those who toiled for hours on end. These are fifers in innings of 600+ runs.
9. Bowling on and on and on ... in 600+ innings
MtId Year For Vs  Score HA Bowler          BT I <--Analysis--> R

0193 1930 Win Eng-849/10 H Scott O.C        S 1 80.2-13-266- 5 =
0198 1930 Eng Aus-695/10 H Peebles I.A.R    S 2 71.0- 8-204- 6 *
0740 1974 Ind Eng-629/10 A Bedi B.S         S 1 64.2- 8-226- 6 *
0564 1964 Aus Eng-611/10 A McKenzie G.D       2 60.0-15-153- 7 =
0235 1934 Aus Eng-627/ 9 A O'Reilly W.J     S 1 59.0- 9-189- 7 =
0279 1946 Eng Aus-645/10 A Wright D.V.P     S 1 58.2- 4-167- 5 *
1911 2009 Eng Win-749/ 9 A Swann G.P          2 50.4- 8-165- 5 =
0970 1983 Aus Pak-624/10 H Lillee D.K         2 50.2- 8-171- 6 =
0851 1979 Ind Eng-633/ 5 A Kapil Dev N        1 48.0-15-146- 5 *
1079 1987 Eng Pak-708/10 H Dilley G.R         1 47.3-10-154- 6 =
0645 1969 Aus Win-616/10 H Connolly A.N       3 45.2- 7-122- 5 =
1852 2007 Pak Ind-626/10 A Yasir Arafat       1 39.0- 5-161- 5 =
0945 1983 Ind Pak-652/10 A Kapil Dev N        2 38.4- 3-220- 7 *
0259 1937 Eng Aus-604/10 A Farnes K           1 38.1- 5- 96- 6 *
1912 2009 Pak Slk-606/10 H Umar Gul           1 37.0- 2-135- 6 =
1935 2009 Slk Ind-642/10 A Herath HMRKB     S 1 33.0- 2-121- 5 *
0989 1984 Eng Win-606/10 H Pringle D.R        2 31.0- 5-108- 5 *
0304 1948 Ind Win-631/10 H Rangachari C.R     1 29.4- 4-107- 5 =
This table is ordered by balls bowled. Scott bowled a third of the team
overs. Lucky he got a couple of wickets in the end. Peculiar match. A
timeless Test, which was drawn, by agreement. West Indies fall behind by
577 runs and England bat again. Then Headley's famous 223 saves the
match. 9 days, and no result. A follow-on and they might very well have
won by an innings. I know Shri might have something to say: but strange
captaincy by Hon.FSG Calthorpe, the lone "gentleman" in the team. Over 9
days, he scored 13, bowled 4 overs and batted when he should have
bowled.
Commendable are McKenzie and Kapil Dev who captured 7 wickets amongst
the batting mayhem although Kapil went for nearly 6 runs per over,
thanks to four Pakistani centuries. Also noteworthy is Farnes' capturing
6 for 96 out of a 600+ total.
Now for some nice alternate tables. First is the one where the bowlers have been very economical.
10. 5-wkt bowling performances with RpO less than 1.0
MtId Year For Vs  Score HA Bowler          BT I <--Analysis--> R  RpO

0527 1962 Win Ind-187/10 H Gibbs L.R        S 3 53.3-37- 38- 8 W 0.71
0212 1931 Aus Saf-170/10 H Ironmonger H       2 47.0-29- 42- 5 W 0.89
0413 1955 Pak Nzl-124/10 H Zulfiqar Ahmed   S 3 46.3-21- 42- 6 W 0.90
0479 1959 Aus Pak-134/10 A Mackay K.D         3 45.0-27- 42- 6 W 0.93
1104 1988 Pak Aus-165/10 H Iqbal Qasim      S 2 39.0-24- 35- 5 W 0.90
0413 1955 Pak Nzl-164/10 H Zulfiqar Ahmed   S 1 37.2-19- 37- 5 W 0.99
0785 1976 Ind Nzl-141/10 H Bedi B.S         S 4 33.0-18- 27- 5 W 0.82
1113 1989 Win Aus-401/10 A Marshall M.D       2 31.0-16- 29- 5 * 0.94
0025 1887 Eng Aus- 97/10 A Barnes W           4 30.4-29- 28- 6 W 0.91
1394 1998 Slk Zim-140/10 H Muralitharan M   S 2 29.0-18- 23- 5 W 0.79
0277 1946 Eng Ind-170/10 H Pollard R          2 27.0-16- 24- 5 = 0.89
0593 1965 Eng Nzl-166/10 H Titmus F.J       S 3 26.0-17- 19- 5 W 0.73
0456 1958 Eng Nzl- 67/10 H Laker J.C        S 1 22.0-11- 17- 5 W 0.77
0707 1973 Aus Pak-106/10 H Walker M.H.N       4 21.2- 8- 15- 6 W 0.70
0250 1936 Aus Saf-157/10 A O'Reilly W.J     S 1 21.0-11- 20- 5 W 0.95
0434 1956 Eng Saf- 72/10 A Bailey T.E         4 20.4- 6- 20- 5 W 0.97
0009 1882 Eng Aus- 63/10 H Barlow R.G         1 20.4-22- 19- 5 * 0.92
1516 2000 Aus Win- 82/10 H McGrath G.D        1 20.0-12- 17- 6 W 0.85
0381 1954 Saf Nzl- 79/10 H Tayfield H.J     S 2 18.4- 7- 13- 6 W 0.70
1156 1990 Ind Slk- 82/10 H Raju S.L.V       S 2 17.5-13- 12- 6 W 0.67
0681 1971 Eng Nzl- 65/10 A Underwood D.L    S 1 15.4- 7- 12- 6 W 0.77
0212 1931 Aus Saf-117/10 H Wall T.W           3 15.1- 7- 14- 5 W 0.92
0906 1981 Eng Aus-121/10 H Botham I.T         4 14.0- 9- 11- 5 W 0.79
1687 2004 Eng Win- 47/10 A Harmison S.J       3 12.3- 8- 12- 7 W 0.96
0047 1896 Eng Saf- 30/10 A Lohmann G.A        4  8.1- 5-  7- 8 W 0.86
0216 1932 Aus Saf- 36/10 H Ironmonger H       1  7.2- 5-  6- 5 W 0.82
1630 2002 Win Bng- 87/10 A Lawson J.J.C       3  6.5- 4-  3- 6 W 0.44
0290 1947 Aus Ind- 58/10 H Toshack E.R.H      2  3.1- 1-  2- 5 W 0.63
These are matches in which the number of overs bowled are greater than
the number of runs conceded. This is ordered by the number of overs
bowled. The table is led by Gibbs who had a RpO value of 0.71 while
bowling 53 overs and capturing 8 wickets. Is it is possible today ?
Look at Marshall's performance, the stand-out one amongst this lot. Out
of an Australian total of 401, he captures 5 for 29, at an RpO of 0.94,
while his compatriots capture 5 for 338, at an RpO figure of 2.1. In
fact he just misses out on the out-performer table, with a ratio of
11.7. Lohmann's 8 for 7 has appeared in various tables. Only point of
question would be the dicey quality of South African batting and the
minefields he bowled on.
Now for the final table in this first part article. The two extreme sets of fifers.
11. The two extremes of 5-wkt bowling performances
MtId Year For Vs  Score HA Bowler          BT I <--Analysis--> R

0193 1930 Win Eng-849/10 H Scott O.C        S 1 80.2-13-266- 5 =
0371 1953 Ind Win-576/10 A Mankad M.H       S 2 82.0-17-228- 5 =
0740 1974 Ind Eng-629/10 A Bedi B.S         S 1 64.2- 8-226- 6 *
0945 1983 Ind Pak-652/10 A Kapil Dev N        2 38.4- 3-220- 7 *
1892 2008 Aus Ind-441/10 A Krejza J.J         1 43.5- 1-215- 8 *
1336 1996 Zim Pak-553/10 A Strang P.A       S 2 69.0-12-212- 5 =
0198 1930 Eng Aus-695/10 H Peebles I.A.R    S 2 71.0- 8-204- 6 *
0503 1961 Pak Ind-539/ 9 A Haseeb Ahsan     S 2 84.0-19-202- 6 =
...
...
...
1720 2004 Aus Ind-205/10 A Clarke M.J       S 3  6.2- 0-  9- 6 *
1210 1993 Aus Win-146/10 H May T.B.A        S 3  6.5- 3-  9- 5 *
0047 1896 Eng Saf- 30/10 A Lohmann G.A        4  8.1- 5-  7- 8 W
0153 1924 Eng Saf- 30/10 H Gilligan A.E.R     2  6.3- 4-  7- 6 W
0216 1932 Aus Saf- 36/10 H Ironmonger H       1  7.2- 5-  6- 5 W
1630 2002 Win Bng- 87/10 A Lawson J.J.C       3  6.5- 4-  3- 6 W
0290 1947 Aus Ind- 58/10 H Toshack E.R.H      2  3.1- 1-  2- 5 W
This is the one table which contains the two ends of the bowling
spectrum. Fifers for 200 runs and above and fifers for 10 runs and
below. Most of these bowlers have already appeared in the earlier tables
and this is just a different classification. Spare a thought for poor
Krejza. On debut he toils hard with a 8-for-million performance and then
is forgotten.
Barring table 8, which points to a slightly negative aspect of bowlers,
in which Muralitharan appears three times, he has appeared 10 times in
the other 11 tables. This may not be conclusive but is a pointer to the
range and depth of his bowling achievements. Lohmann, no surprise,
appears 8 times. Signs of the times he bowled in. Two bowlers,
contrasting in their teams' strengths, McGrath and Kapil, appear 7 times
each. Wasim and Waqar appear very few times. That is a sign of the way
they shared the spoils.